


Join Our Telegram channel to stay up to date on breaking news coverage
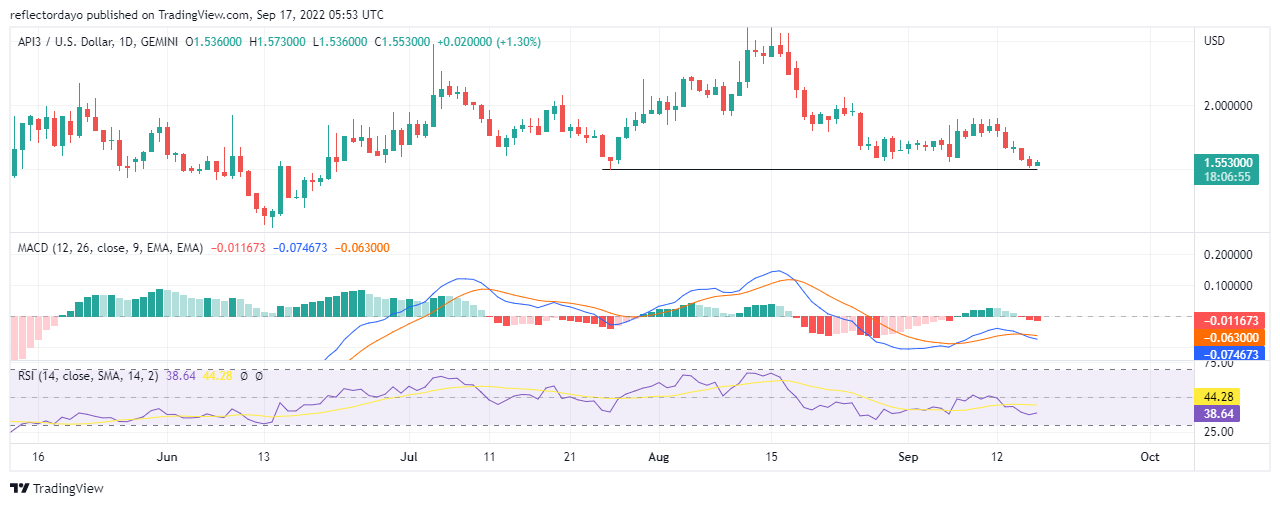
The struggle between demand and supply API3/USD has kept the price ranging between $1.500000 and $2.000000. And as the price actions reached the support level of $1.532983, it is very likely the price bounces up to seek higher resistance. But this bullish price recovery attempt appears to be weak. And as a result of this, bulls and bears are holding up against each other.
API3 Market Price Statistic:
- API3/USD price now: $1.558000
- API3 /USD market cap: $ 87,895,228
- API3 /USD circulating supply: 56,547,601.00
- API3 /USD total supply: 114,855,860
- API3 /USD coin market ranking: #265
Key Levels
- Resistance: $1.782156, $2.000000, $2.308361
- Support: $1.361677, $1.205944, $1.050211
Buy The API3 Now
Your capital is at risk
API3 Market Price Analysis: The Indicators’ Point of View

As the struggle between buyers and sellers continues, the price continues to move in the down-trend territory. The Moving Average Convergence and Divergence histogram that represents today’s trading session, so far, is still bearish. As far as the MACD indicator is concerned, for now, this bullish candlestick on the daily chart cannot be reckoned with; The market, on a general outlook, is still considered bearish. More buying pressure is still needed to push this market up.
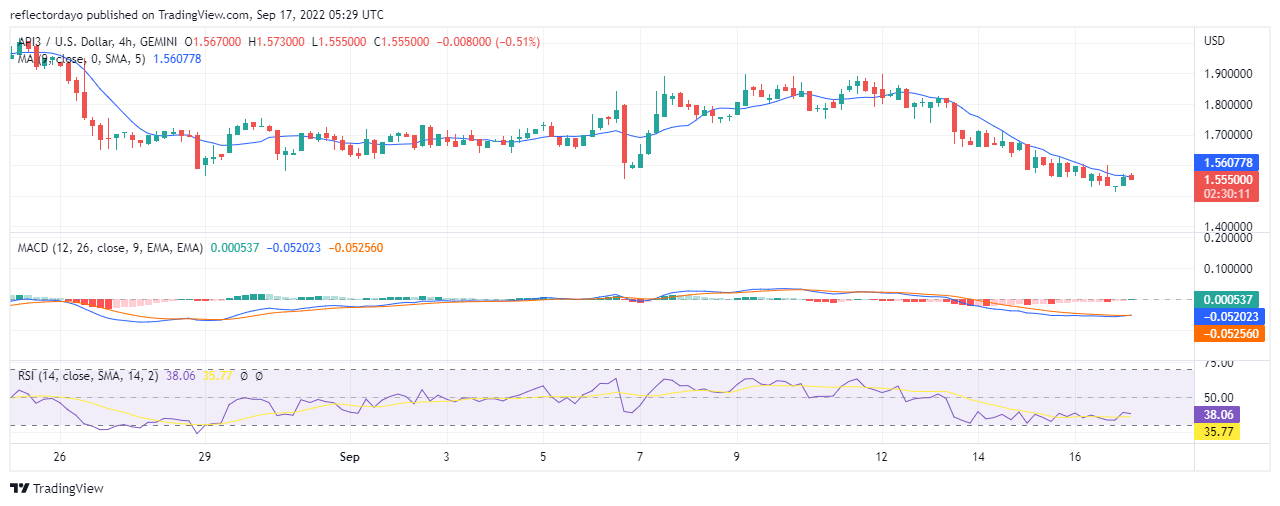
API3 /USD 4-Hour Chart Outlook
The last 4-hour session of yesterday’s market closed in favour of bears. The first 4-hour session for today’s market activities closed with strong market indecision. The buyers grew stronger in the second session only to lose out to the sellers in the third session. In this timeframe, we can see that the price continues to consolidate. From the view of the indicators, the price is now ranging sideways below the strong market zone. Both buying pressure and selling pressure are not showing much strength needed to decide the direction of this market.
Related
Tamadoge – Play to Earn Meme Coin

- Earn TAMA in Battles With Doge Pets
- Capped Supply of 2 Bn, Token Burn
- NFT-Based Metaverse Game
- Presale Live Now – tamadoge.io
Join Our Telegram channel to stay up to date on breaking news coverage
