alexsl/iStock Unreleased via Getty Images
Thesis
The stock market is notorious for completely ignoring business fundamentals at both the greed and feel extreme, as illustrated by the current conditions of Alibaba (NYSE:BABA) and Amazon (NASDAQ:AMZN). The contrast between these two stocks is so stark that it not only serves to show a specific investment opportunity but also serves as a general example of market psychology. Admittedly, these two stocks are not entirely comparable and there are certainly differences. Some of the uncertainties and risks faced by BABA are not shared by AMZN.
And my thesis here is that the current market valuation has already priced in all the risks surrounding BABA. More specifically,
- BABA’s stock price has recently become dominated by market sentiment and disconnected from fundamentals. Its stock prices easily fluctuated 10%-plus in a few days or even a single day recently in response to news and sentiments that may or may not have direct relevance to its business fundamentals. On the other hand, AMZN’s stock price seemed to be immune from news and fundamentals. It has been trading sideways in a narrow range (and at an elevated valuation) despite its mounting cash flow issues and all the geopolitical and macroeconomic risks.
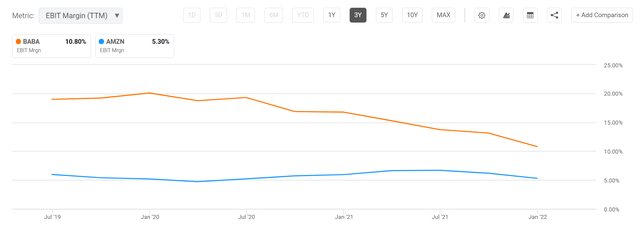
- As shown in the next chart, both BABA and AMZN are valued at about 1.8x and 3.2x price to sales ratio, respectively, a discount by almost a factor of 2x (1.8x to be exact). As we look deeper next, the discount becomes even larger than on the surface. The second chart compares the profit margin between BABA and Amazon. BABA’s EBIT profit margin is almost twice that of Amazon – not only shows BABA’s superior profitability (and AMZN’s concerning and deteriorating profitability) but also further highlights the valuation gap. The sales of BABA should be worth about 2x as valuable as that of AMZN because of the higher margin, but the current valuation is the opposite. And as you were seeing the remainder of this article, BABA also enjoys superior fundamentals in other keys aspects, such as R&D output, return on capital employed, and growth potential.
- Finally, aside from their drastically different valuations, there are many comparable aspects between these two e-commerce giants. And a comparison between them could also provide insights into the evolving e-commerce landscape. Comparing what they are researching and developing gives us a peek at the future investment direction in this space.
Seeking Alpha Seeking Alpha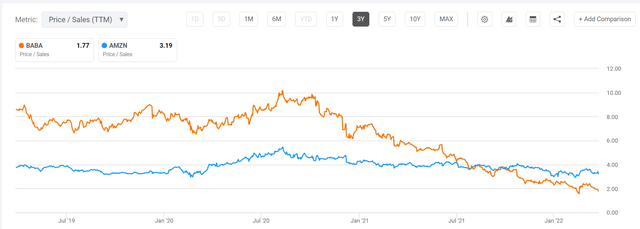
Both R&D aggressively but BABA enjoys way better yield
As mentioned in our earlier writings, we do not invest in a given tech stock because we have high confidence in a certain product that they are developing in the pipeline. Instead, we are more focused on A) the recurring resources available to fund new R&D efforts sustainably, and B) the overall efficiency of the R&D process.
So let’s first see how well and sustainably BABA and AMZN can fund their new R&D efforts. The short answer is: Extremely well. The next chart shows the R&D expenses of BABA and AMZN over the past decade. As seen, both have been consistently investing heavily in R&D in recent years. AMZN didn’t spend meaningfully on R&D before 2016. But since 2016, AMZN on average has been spending about 12% of its total revenue on R&D efforts. And BABA spends a bit less, on average 10%. Both levels are consistent with the average of other overachievers in the tech space, such as the FAAMG group.
Author based on Seeking Alpha data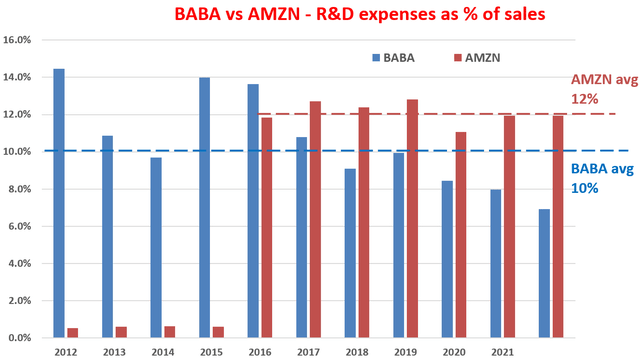
Then the next question is, how effective is their R&D process? This is where the contrast kicks in as shown in the next chart. The chart shows a variation of Buffett’s $1 test on R&D expenses. Advised by Buffett, we do not only listen to CEOs’ pitches on their brilliant new ideas that will shake the earth (again). We also examine the financials to see if their words are corroborated by the numbers. And in BABA and AMZN’s cases, their numbers are shown here. The analysis method is detailed in our earlier writings and in summary:
- The purpose of any corporate R&D is obviously to generate profit. Therefore, this analysis quantifies the yield by taking the ratio between profit and R&D expenditures. We used the operating cash flow as the measure for profit.
- Also, most R&D investments do not produce any result in the same year. They typically have a lifetime of a few years. Therefore, this analysis assumes a three-year average investment cycle for R&D. And as a result, we used the three-year moving average of operating cash flow to represent this three-year cycle.
As you can see, the R&D yield for both has been remarkably consistent although at different levels. In BABA’s case, its R&D yield has been steady around an average of $3.3 in recent years. This level of R&D yield is very competitive even among the overachieving FAAMG group. The FAAMG group boasts an average R&D yield of around $2 to $2.5 in recent years. And the only one that generates a significantly high R&D yield in this group is Apple (AAPL), which generates an R&D yield of $4.7 of profit output from every $1 of R&D expenses.
AMZN’s R&D yield of $0.9, on the other hand, is substantially lower than BABA’s and is also the lowest among the FAAMG group. And note that since AMZN didn’t spend meaningfully on R&D before 2016, we only started reporting its R&D yield starting in 2016.
Next, we will examine their profitability to fuel their R&D efforts sustainably and also dive into some of the specific R&D efforts they are undertaking.
Author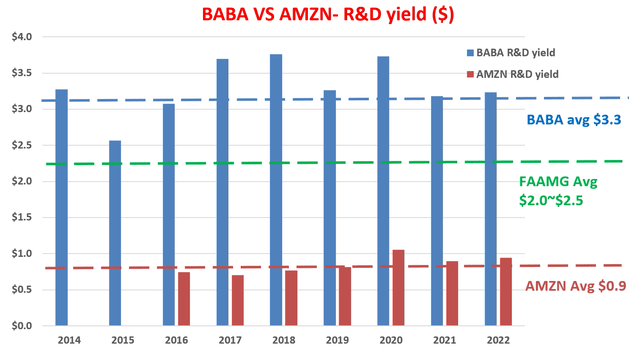
BABA enjoys far superior profitability
As explained in our earlier writings, to us, the most important profitability measure is ROCE (return on capital employed) because:
ROCE considers the return of capital ACTUALLY employed and therefore provides insight into how much additional capital a business needs to invest in order to earn a given extra amount of income – a key to estimating the long-term growth rate. Because when we think as long-term business owners, the growth rate is “simply” the product of ROCE and reinvestment rate, i.e.,
Long-Term Growth Rate = ROCE * Reinvestment Rate
The ROCE of both stocks has been detailed in our earlier articles and I will just directly quote the results below. In this analysis, I consider the following items capital actually employed A) Working capital (including payables, receivables, inventory), B) Gross Property, Plant, and Equipment, and C) Research and development expenses are also capitalized. As you can see, BABA was able to maintain a remarkably high ROCE over the past decade. It has been astronomical in the early part of the decade exceeding 150%. It has declined due to all the drama in recent years that you are familiar with (China’s tightened regulations, high tax rates, slow-down of the overall economic growth in China, et al). But still, its ROCE is on average about 95% in recent years.
AMZN’s ROCE has shown a similar pattern. It too has enjoyed a much higher ROCE in the early part of the decade. And it too has witnessed a steady decline over the years. In recent years, its ROCE has been relatively low, with an average of around 29%. A ROCE of 29% is still a healthy level (my estimate of the ROCE for the overall economy is about 20%). However, it’s not comparable to BABA or other overachievers in the FAANG pack.
Next, we will examine their key segments and initiatives to form a projection of their future profitability and growth drivers.
Author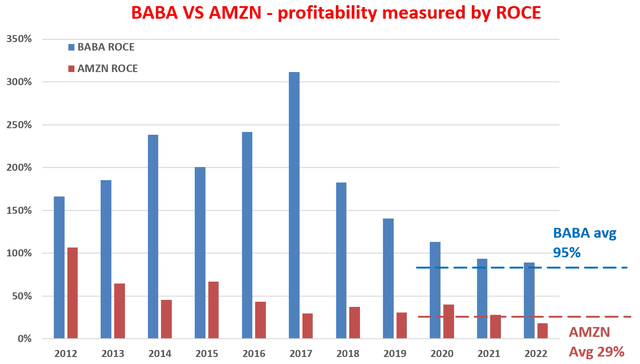
Growth prospects and final verdict
Looking forward, I see both as well poised to benefit from the secular trend of e-commerce penetration. When we are so used to the American way of online shopping, it’s easy to form the impression that e-commerce has already saturated. The reality is that the global e-commerce penetration is still ONLY at about 20% currently. Meaning 80% of the commerce is still currently conducted offline. In terms of absolute volume, as you can see from the following chart, global retail e-commerce sales have reached $4.2 trillion in 2020. And it’s projected to almost double by 2026, reaching $7.4 trillion of revenues in the retail e-commerce business. The e-commerce movement is just getting started and the bulk of the growth opportunity is yet to come. And leaders like BABA and AMZN are both best poised to capitalize on this secular trend.
OBERLO data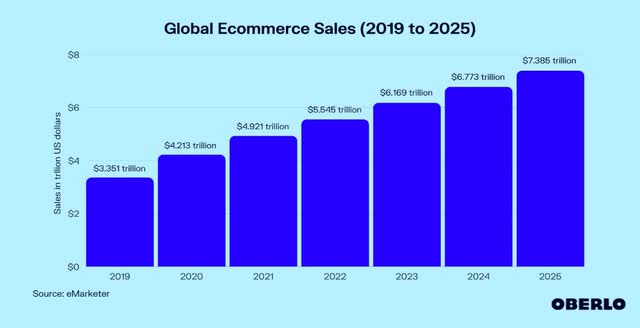
I also see both enjoy tremendous growth opportunities in other areas besides e-commerce. Both are leaders in the cloud computing space, especially in their own geographical areas. This segment has tremendous growth potential as the world shifts to the pure “pay per use” model, and the growth is just starting as start-ups, enterprises, government agencies, and academic institutions shift their computing needs to this new model. In BABA’s case, its cloud computing, international avenues, and domestic platform expansion are all enjoying momentum. These segments all show promise for profitability and growth in the near future to maintain their high R&D yield and high ROCE. Similarly, AMZN’s AWS unit is expected to grow significantly in the near future to help lift the bottom line. It has recently announced offerings such as Cloud WAN, a managed wide area network, and Amplify Studio, a new visual development environment. Moreover, AMZN’s also announced the planned $8.45 billion purchase of MGM Movie Studios, and I’m optimistic about the synergies with its streaming businesses.
Also, I do see some asymmetric growth opportunities for BABA. As aforementioned, both stocks are best poised to capitalize on the world’s unstoppable shift toward e-commerce. However, the remaining shift will be unevenly distributed and the Asian-Pacific region will be the center of the momentum. As shown in the chart above, world retail e-commerce sales are expected to exceed $7.3 trillion by 2025. The twist is that the Asian-Pacific region will be where most of the growth will be. By 2023, the Western continents will contribute 16% of the total B2B e-commerce volume, while the remaining 84% would come from the non-Western world. And BABA is best poised to benefit with its scale and reach, government support, and cultural and geographic proximity.
Finally, the following table summarizes all the key metrics discussed above. As mentioned early on, my thesis is that the risks surrounding BABA have been fully priced in already. Even if we put aside the issue of valuations and risks, there are many comparable aspects between these two e-commerce giants (probably more than their differences). Comparing and contrasting their R&D efforts, profitability, and future growth areas not only elucidate their own investment prospects but also provide insight into other e-commerce investment opportunities.
Author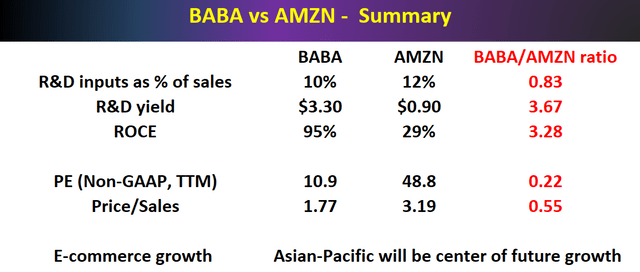
Risks
I do not think there is a need to repeat BABA’s risks anymore. Other SA authors have provided excellent coverage already. And we ourselves have also assessed these risks based on a Kelly analysis.
For AMZN, a key issue I recommend investors to keep a close on in the upcoming earnings release is the leasing accounting. We have cautioned readers before the 2021 Q4 earnings release about the role of its lease accounting and the possibility of its free cash flow (“FCF”) deterioration after being adjusted for leasing accounting. And as you can see from the following chart, unfortunately, its FCF has indeed suffered a dramatic deterioration to a negative $20B in 2021 Q4. In the incoming 2022 Q1 release, this is a key item that I would be watching.
AMZN 2021 Q4 earnings release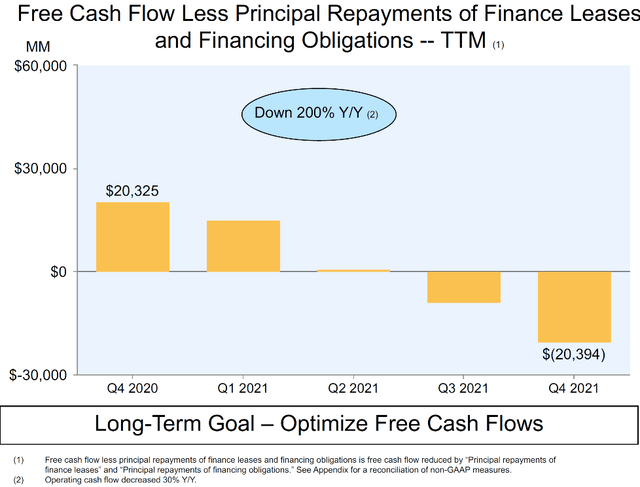
Summary and final thoughts
The stock market is notorious for completely ignoring business fundamentals both at the greed extreme and at the fear extreme. The stark contrast between BABA and AMZN serves as a general example of such market psychology so investors could identify mispricing opportunities.
The thesis is that BABA is now in the extreme fear end of the spectrum and its stock price has recently become disconnected from fundamentals. In particular,
- The current market valuation has already priced in all the risks surrounding BABA. BABA’s price to sales ratio is discounted by almost half relative to AMZN despite its higher margin and profitability.
- Both stocks pursue new opportunities aggressively with 10% to 12% of their total sales spent on R&D efforts, but BABA enjoys a far better yield.
- I also see both well poised to benefit from the secular trend of global e-commerce penetration and also from the opportunities in other areas such as cloud computing. However, I do see some asymmetries here. For example, the remaining e-commerce shift will be unevenly distributed and the Asian-Pacific region will be the center of the momentum, where BABA is better positioned to benefit from its government support and cultural/geographic proximity.


