

RgStudio/E+ via Getty Images
My greatest passion in life is teaching investors like you the secrets to long-term riches and prosperity.
Above all this means focusing on safety and quality first, and prudent valuation and sound risk-management always.
When forced to choose, I will not trade even a night’s sleep for the chance of extra profits.” – Warren Buffett
Today the market is awash in pain and anguish for many new investors, who thought that 3 years of 25% annual returns could continue forever.
Daily Shot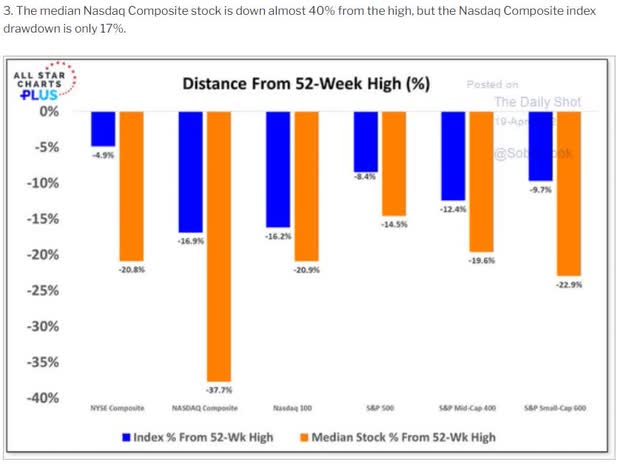
The Nasdaq composite is about 2,500 companies, roughly 50% of all US-traded companies.
And the median decline right now is 38%. The average market decline in a recession is 36%, so effectively much of the stock market is already priced as if we were in a recession.
But such short-term pain brings the potential for long-term profits.
Ycharts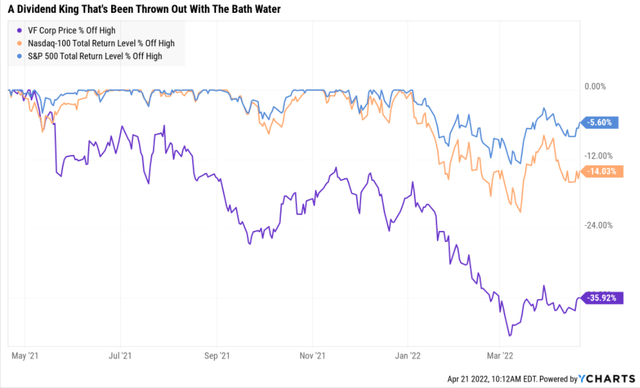
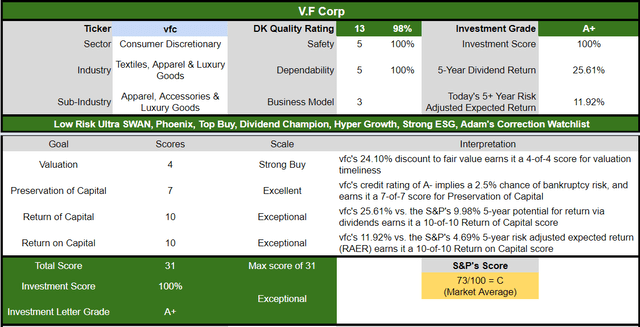
Today I wanted to highlight why V.F Corp (NYSE:VFC) is one of the best dividend aristocrat bargains you can safely buy today.
Why? Because VFC is one of the greatest companies on earth, and a proven maser of building long-term income and wealth over time.
VFC Rolling Returns Since 1986
Portfolio Visualizer Premium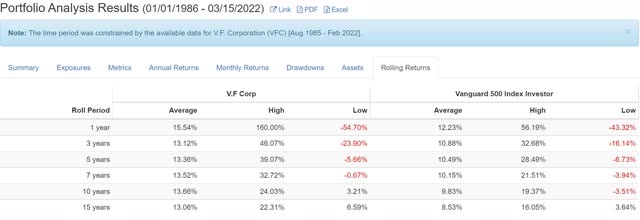
Buying VFC during bear markets can deliver returns as strong as 22% CAGR for the next 15 years.
- up to 20X returns
- Buffett-like returns from a low-risk Ultra SWAN dividend king bargain hiding in plain sight
So join me as I show you the three reasons I’ve been buying VFC in this correction and why it might be just what your portfolio needs to help you retire in safety and splendor.
Reason One: World-Class Quality You Can Trust
There are many ways to define and measure quality. So how do I do it?
The Dividend King’s overall quality scores are based on a 248 point model that includes:
-
dividend safety
-
balance sheet strength
-
credit ratings
-
credit default swap medium-term bankruptcy risk data
-
short and long-term bankruptcy risk
-
accounting and corporate fraud risk
-
profitability and business model
-
growth consensus estimates
-
management growth guidance
-
historical earnings growth rates
-
historical cash flow growth rates
-
historical dividend growth rates
-
historical sales growth rates
-
cost of capital
-
GF Scores
-
long-term risk-management scores from MSCI, Morningstar, FactSet, S&P, Reuters’/Refinitiv, and Just Capital
-
management quality
-
dividend friendly corporate culture/income dependability
-
long-term total returns (a Ben Graham sign of quality)
-
analyst consensus long-term return potential
In fact, it includes over 1,000 fundamental metrics including the 12 rating agencies we use to assess fundamental risk.
- credit and risk management ratings make up 41% of the DK safety and quality model
- dividend/balance sheet/risk ratings make up 82% of the DK safety and quality model
How do we know that our safety and quality model works well?
During the two worst recessions in 75 years, our safety model 87% of blue-chip dividend cuts, the ultimate baptism by fire for any dividend safety model.
And then there’s the confirmation that our quality ratings are very accurate.
DK Zen Phoenix: Superior Fundamentals Lead To Superior Long-Term Results
| Metric | US Stocks | 191 Real Money DK Phoenix Recs |
| Great Recession Dividend Growth | -25% | 0% |
| Pandemic Dividend Growth | -1% | 6% |
| Positive Total Returns Over The Last 10 Years | 42% | 99.5% (Greatest Investors In History 60% to 80% Over Time) |
| Lost Money/Went Bankrupt Over The Last 10 Years | 47% | 0.5% |
| Outperformed Market Over The Last Decade (290%) | 36% | 46% |
| Bankruptcies Over The Last 10 Years | 11% | 0% |
| Permanent 70+% Catastrophic Decline Since 1980 | 44% | 0.5% |
| 100+% Total Return Over The Past 10 Years | NA | 87% |
| 200+% Total Return Over The Past 10 Years | NA | 66% |
| 300+% Total Return Over The Past 10 Years | NA | 44% |
| 400+% Total Return Over The Past 10 Years | NA | 35% |
| 500+% Total Return Over The Past 10 Years | NA | 27% |
| 600+% Total Return Over The Past 10 Years | NA | 23% |
| 700+% Total Return Over The Past 10 Years | NA | 20% |
| 800+% Total Return Over The Past 10 Years | NA | 18% |
| 900+% Total Return Over The Past 10 Years | NA | 18% |
| 1000+% Total Return Over The Past 10 Years | NA | 16% |
| Sources: Morningstar, JPMorgan, Seeking Alpha |
Basically, historical market data confirms that the DK safety and quality model is one of the most comprehensive and accurate in the world.
This is why I and my family entrust almost 100% of my life savings to this model and the DK Phoenix blue-chip strategy.
How does VFC score on one of the world’s most comprehensive and accurate safety models?
VFC Dividend Safety
| Rating | Dividend Kings Safety Score (161 Point Safety Model) | Approximate Dividend Cut Risk (Average Recession) |
Approximate Dividend Cut Risk In Pandemic Level Recession |
| 1 – unsafe | 0% to 20% | over 4% | 16+% |
| 2- below average | 21% to 40% | over 2% | 8% to 16% |
| 3 – average | 41% to 60% | 2% | 4% to 8% |
| 4 – safe | 61% to 80% | 1% | 2% to 4% |
| 5- very safe | 81% to 100% | 0.5% | 1% to 2% |
| VFC | 100% | 0.5% | 1.00% |
| Risk Rating | Low Risk (71st industry percentile consensus) | A- stable outlook credit rating 2.5% 30-year bankruptcy risk | 20% OR LESS Max Risk Cap Recommendation |
Long-Term Dependability
| Company | DK Long-Term Dependability Score | Interpretation | Points |
| Non-Dependable Companies | 21% or below | Poor Dependability | 1 |
| Low Dependability Companies | 22% to 60% | Below-Average Dependability | 2 |
| S&P 500/Industry Average | 61% (58% to 70% range) | Average Dependability | 3 |
| Above-Average | 71% to 80% | Very Dependable | 4 |
| Very Good | 81% or higher | Exceptional Dependability | 5 |
| VFC | 100% | Exceptional Dependability | 5 |
Overall Quality
| VFC | Final Score | Rating |
| Safety | 100% | 5/5 very safe |
| Business Model | 60% | 3/3 wide moat |
| Dependability | 100% | 5/5 exceptional |
| Total | 98% | 13/13 Ultra SWAN Dividend King |
| Risk Rating | 3/3 Low Risk | |
| 20% OR LESS Max Risk Cap Rec |
5% Margin of Safety For A Potentially Good Buy |
VFC: 11th Highest Quality Master List Company (Out of 508) = 98th Percentile
The DK 500 Master List includes the world’s highest quality companies including:
-
All dividend champions
-
All dividend aristocrats
-
All dividend kings
-
All global aristocrats (such as BTI, ENB, and NVS)
-
All 13/13 Ultra Swans (as close to perfect quality as exists on Wall Street)
- 47 of the world’s best growth stocks (on its way to 100)
VFC’s 98% quality score means its similar in quality to such blue-chips as
- S&P Global (SPGI) – dividend aristocrat
- W. W. Grainger (GWW) – dividend king
- PayPal (PYPL)
- Ilumina (ILMN)
- West Pharmaceutical Services (WST) – dividend champion
- ASML Holding (ASML)
- Colgate-Palmolive (CL) – dividend king
- Visa (V)
- Mastercard (MA)
- Microsoft (MSFT)
Even among the most elite companies on earth, VFC is higher quality than 98% of them.
Why I Trust VFC And So Can You
VFC is built to last. How do we know this?
- founded in 1899 in Denver, Colorado
VFC has survived and thrived through
- 24 recessions
- two depressions
- three economic crises/panics
- inflation ranging from -2.5% to 20%
- interest rates ranging from 0% to 20%
- 10-year Treasury yields ranging from 0.5% to 16%
- 11 bear markets
- dozens of corrections and pullbacks
VFC owns 15 popular brands of sports and activewear including
- Vans
- The North Face
- Timberland
- Supreme
- and Dickies
- 50% of sales from the US
- 27% from central and south America
- 14% Europe
- 8% other
Investment Thesis Summary
Through dispositions and additions, VF has built a portfolio of strong brands in multiple apparel categories. We view the three brands that account for about 80% of its sales (Vans, Timberland, and The North Face) as supporting VF’s narrow moat based on a brand intangible asset. Despite short-term disruption from the COVID-19 crisis and economic weakness in China, we believe VF will grow faster than most competitors in the long run and maintain its competitive edge.” – Morningstar
Exceptional Management You Can Trust
We assign a capital allocation rating of Exemplary to VF. We believe the firm has produced strong returns for shareholders….
VF has a strong balance sheet and capacity for further acquisitions. The firm consistently generates more than $1 billion per year in free cash flow to equity, and its capital expenditures have only averaged 2% of sales over the past decade. Thus, it accumulates significant cash for investment and can borrow money at low rates….
VF has a solid record of returning cash to shareholders. It has increased its dividend (adjusted for the Kontoor spin) for 50 consecutive years and has typically paid shareholders 30%-50% of its earnings as dividends. We anticipate consistent annual dividend increases through this decade….
Over the next five years, we forecast the company will generate $7.8 billion in free cash flow to equity and return most of it to shareholders in dividends and, to a lesser degree, stock buybacks. We believe a company increases shareholder value if it repurchases stock below its intrinsic value.
VF has managed its portfolio of brands well and has delivered consistent returns to shareholders (an annual average of 11% over the past 15 years, as of January 2022)…
VF targets 14%-16% annualized total shareholder return over the next few years, which may be achievable. ” – Morningstar
I agree 100% with Morningstar’s view because VFC is an excellent investor in apparel and lifestyle brands, with an exceptional track record of:
- smart acquisitions
- brand building
- very shareholder and dividend friends
- a highly adaptable management team and corporate culture
- conservative balance sheet and payout ratios are what has allowed it to become a dividend king
We delivered strong results in Q3 with organic revenue growth of 16% and organic earnings growth of 32% amidst continuing macro headwinds. Our business is strong and healthy. We achieved our Q3 plan driven by a robust holiday performance and an exceptional quarter from the North Face, which gained further momentum and surpassed $1.2 billion in revenue, a record in its history…
We continue to see broad-based growth across categories with snow sports, sportswear and logowear, all growing over 20%…
Off-mountain lifestyle products also showed ongoing strong momentum. The newly launched techwear line, mountain-inspired clothes designed for the city grew over 60% and lifestyle footwear grew 30%… – CEO, Q4 conference call
VFC’s brands are very popular and sales are growing rapidly. Its new brands are also experiencing blockbuster success.
The XPLR Pass loyalty program grew exponentially this quarter, adding 1.1 million new members and 33% more sign-ups during holiday weeks relative to last year, driven by the digital channel.
Total membership is now approaching 9 million, growing about 30% fiscal year-to-date…
Moving on to Vans, which grew 8% in Q3, representing modest growth relative to pre-pandemic levels. Global digital growth continues to be strong, up 54% relative to fiscal ’20 driving 9% D2C growth relative to pre-pandemic levels.” – CEO, Q4 conference call
Digital and direct-to-consumer execution is going very well.
In 2019 VFC announced guidance for the next five years (still in effect).
- 7% to 8% sales growth
- 12% to 14% EPS growth
- 14% to 16% CAGR total returns
- back then VFC yielded 2%
- now it yields almost twice as much
- total return guidance now: 15.6% to 17.6% CAGR
- on par with the greatest investors in history, like John Templeton
- 15.8% CAGR returns from 1953 to 1992
VFC has a solid plan to deliver higher margins and exceptional long-term shareholder returns.
It’s a master of successful M&A having made 16 acquisitions in the last 21 years.
The company’s strategy is heavily focused on:
- growing Asian sales
- driving more direct-to-consumer (higher margin) sales (Nike’s strategy)
- build strong brand loyalty (a focus on lifestyle brands)
- keep driving strong growth in current brands and continue acquiring new ones
VFC’s latest acquisition increases its total addressable market to $500 billion vs $11.2 billion last year. With just about a 2% market share, VFC’s growth runway is long and vast.
Supreme is the most recent brand acquisition, which has a target market of $50 billion per year and that’s growing at double-digits.
Management thinks it can keep Supreme growing at 8% to 10%, slightly faster than the overall company.
And Vans which represents 33% of sales, continues to grow at 12% to 13% and with operating margins of almost 25% (double the company’s overall levels).
VFC Credit Ratings
| Rating Agency | Credit Rating | 30-Year Default/Bankruptcy Risk | Chance of Losing 100% Of Your Investment 1 In |
| S&P | A- stable | 2.50% | 40.0 |
| Moody’s | Baa1 (BBB+ equivalent) | 5.00% | 20.0 |
| Consensus | A- stable | 3.75% | 26.7 |
(Sources: S&P, Moody’s)
VFC has an A-credit rating from S&P and Moody’s will likely upgrade their rating in the next few years.
VFC Leverage Consensus Forecast
| Year | Debt/EBITDA | Net Debt/EBITDA (3.0 Or Less Safe According To Credit Rating Agencies) |
Interest Coverage (8+ Safe) |
| 2020 | 4.53 | 3.70 | 7.90 |
| 2021 | 3.34 | 2.61 | 10.81 |
| 2022 | 2.70 | 2.01 | 14.55 |
| 2023 | 2.41 | 1.98 | 19.44 |
| 2024 | 1.95 | 2.31 | 30.51 |
| 2025 | NA | NA | 35.82 |
| Annualized Change | -18.94% | -11.05% | 40.17% |
(Source: FactSet Research Terminal)
Because VFC’s balance sheet is expected to get a lot stronger after taking a beating during the pandemic.
VFC Balance Sheet Consensus Forecast
| Year | Total Debt (Millions) | Cash | Net Debt (Millions) | Interest Cost (Millions) | EBITDA (Millions) | Operating Income (Millions) | Average Interest Rate |
| 2020 | $5,265 | $955 | $4,301 | $113 | $1,163 | $893 | 2.15% |
| 2021 | $5,519 | $1,611 | $4,313 | $127 | $1,651 | $1,373 | 2.30% |
| 2022 | $5,452 | $2,192 | $4,061 | $118 | $2,016 | $1,717 | 2.16% |
| 2023 | $5,214 | $1,836 | $4,268 | $97 | $2,160 | $1,886 | 1.86% |
| 2024 | $4,936 | $2,301 | $5,845 | $71 | $2,525 | $2,166 | 1.44% |
| 2025 | NA | NA | NA | $62 | $2,637 | $2,221 | NA |
| Annualized Growth | -1.60% | 24.59% | 7.97% | -11.31% | 17.79% | 19.99% | -9.52% |
(Source: FactSet Research Terminal)
Debt is expected to decrease gradually over time while cash grows at 25% annually and cash flows at 17% to 20% annually.
VFC Bond Profile
- $3.6 billion in liquidity
- well staggered debt maturities (little problem refinancing maturing bonds)
- 100% unsecured bonds (maximum financial flexibility)
- bond investors are so confident in VFC’s long-term energy transition plan they are willing to lend to it for 16 years at 4.6%
- 2.06% average borrowing cost
- -0.1% inflation-adjusted borrowing costs vs 13.6% returns on capital
- VFC’s borrowing costs are so low that adjusted for inflation, it’s being paid to borrow to grow its business
VFC Credit Default SWAPs: Real-Time Fundamental Risk Analysis From The Bond Market
(Source: FactSet Research Terminal)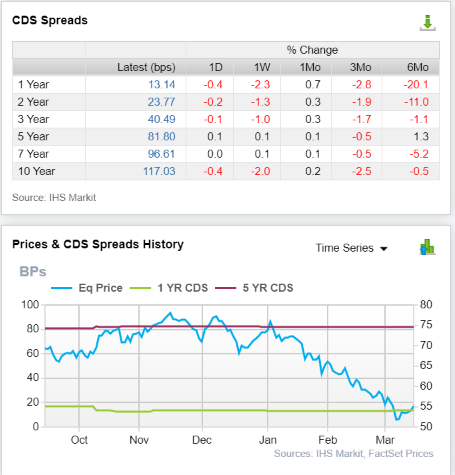
Credit default SWAPs are the insurance policies bond investors take out against default.
- they represent real-time fundamental risk assessment from the “smart money” on Wall Street
- VFC’s fundamental risk has been rock steady for six months
- while the price fell off a cliff
- analysts, rating agencies, and the bond market all agree
- VFC’s thesis is intact
- 25 analysts, 7 rating agencies, and the bond market make up our VFC expert consensus
- how we track fundamental risk in real-time
- to ensure high-probability/low-risk investment recommendations
VFC Profitability: Wall Street’s Favorite Quality Proxy
Historically VFC has maintained above-average profitability compared to its peers.
VFC Trailing 12-Month Profitability Vs Peers
| Metric | Industry Percentile | Major Apparel Companies More Profitable Than VFC (Out Of 1,074) |
| Operating Margin | 79.85 | 216 |
| Net Margin | 81.50 | 199 |
| Return On Equity | 95.90 | 44 |
| Return On Assets | 83.33 | 179 |
| Return On Capital | 90.71 | 100 |
| Average | 86.26 | 148 |
(Source: GuruFocus Premium)
In the last year, VFC’s profitability has soared to the top 14% of its industry.
Adjusting for the natural cyclicality of this industry, VFC’s industry-leading profitability has been stable for over 30 years, confirming a wide and stable moat.
VFC Profit Margin Consensus Forecast
| Year | FCF Margin | EBITDA Margin | EBIT (Operating) Margin | Net Margin | Return On Capital Expansion |
Return On Capital Forecast |
| 2020 | 9.2% | 12.2% | 9.3% | 6.8% | 1.16 | |
| 2021 | 8.2% | 14.7% | 12.2% | 9.6% | TTM ROC | 45.53% |
| 2022 | 8.4% | 16.1% | 13.7% | 10.9% | Latest ROC | 81.48% |
| 2023 | 9.1% | 16.0% | 14.0% | 11.2% | 2025 ROC | 52.67% |
| 2024 | 10.4% | 17.1% | 14.7% | 11.9% | 2025 ROC | 94.25% |
| 2025 | NA | 16.8% | 14.2% | 11.7% | Average | 73.46% |
| 2026 | NA | NA | NA | NA | Industry Median | 9.79% |
| Annualized Growth | 3.10% | 6.72% | 8.71% | 11.35% | VFC/Peers | 7.50 |
| Vs S&P | 5.03 |
(Source: FactSet Research Terminal)
VFC’s margins are expected to recover from the pandemic and keep growing to record highs.
Return on capital is annual pre-tax profit/operating capital (the money it takes to run the business). ROC is Greenblatt’s gold standard proxy for quality and moatiness.
- S&P 500 ROC is 14.6%
- for each $1 it takes to run the average S&P company they generate $0.146 in annual pre-tax profit
- it takes about 6.5 years for new investments to pay for themselves
For VFC ROC was 45% in the last year and is expected to rise to be about 74% in 2025.
- for every $1 it takes to run VFC it is currently generating $0.74 in annual pre-tax profit
- investments take 16 months to pay for themselves
By the definition of one of the greatest investors in history, VFC is about 8X higher quality than its peers and 5X higher quality than the S&P 500.
VFC Dividend Growth Consensus Forecast
| Year | Dividend Consensus | EPS/Share Consensus | Payout Ratio | Retained (Post-Dividend) Cash Flow | Buyback Potential | Debt Repayment Potential |
| 2021 | $1.95 | $2.73 | 71.4% | $303 | 1.42% | 5.5% |
| 2022 | $1.99 | $3.52 | 56.5% | $595 | 2.78% | 10.8% |
| 2023 | $2.02 | $3.94 | 51.3% | $747 | 3.49% | 13.7% |
| 2024 | $2.24 | $4.65 | 48.2% | $937 | 4.38% | 18.0% |
| 2025 | $2.75 | $4.82 | 57.1% | $805 | 3.76% | 16.3% |
| Total 2021 Through 2025 | $10.95 | $19.66 | 55.7% | $3,388.19 | 15.83% | 61.39% |
| Annualized Rate | 8.97% | 15.27% | -5.46% | 27.63% | 27.63% | 31.25% |
(Source: FactSet Research Terminal)
Credit rating agencies consider 60% a safe payout ratio for this industry.
VFC normally maintains a very safe 40% payout ratio (30% to 50% historical range).
Analysts expect the payout ratio to return to safe levels this year (2023 on a free cash flow basis).
$3.4 billion in consensus post-dividend retained earnings is enough to pay off 61% of current debt or buy back 16% of shares at current valuations.
| Year | Consensus Buybacks ($ Millions) | % Of Shares (At Current Valuations) | Market Cap |
| 2017 | $760.0 | 3.6% | $21,401 |
| 2018 | NA | NA | $21,401 |
| 2019 | NA | NA | $21,401 |
| 2020 | $249.0 | 1.2% | $21,401 |
| 2021 | $267.0 | 1.2% | $21,401 |
| 2022 | $552.0 | 2.6% | $21,401 |
| Total 2017-2022 | $1,828.00 | 8.5% | $21,401 |
| Annualized Rate | 2.20% | Average Annual Buybacks | $457.00 |
(Source: FactSet Research Terminal)
VFC’s historical buybacks since 1989 have averaged 1.1% of net shares each year.
Analysts expect more than double that rate in 2022 (2.6%).
| Time Frame (Years) | Net Buyback Rate | Shares Remaining | Net Shares Repurchased |
| 5 | 1.1% | 94.62% | 5.38% |
| 10 | 1.1% | 89.53% | 10.47% |
| 15 | 1.1% | 84.71% | 15.29% |
| 20 | 1.1% | 80.15% | 19.85% |
| 25 | 1.1% | 75.84% | 24.16% |
| 30 | 1.1% | 71.76% | 28.24% |
| 35 | 1.1% | 67.90% | 32.10% |
| 40 | 1.1% | 64.25% | 35.75% |
| 45 | 1.1% | 60.79% | 39.21% |
| 50 | 1.1% | 57.52% | 42.48% |
| 55 | 1.1% | 54.42% | 45.58% |
| 60 | 1.1% | 51.50% | 48.50% |
| 65 | 1.1% | 48.73% | 51.27% |
| 70 | 1.1% | 46.10% | 53.90% |
| 75 | 1.1% | 43.62% | 56.38% |
| 80 | 1.1% | 41.28% | 58.72% |
| 85 | 1.1% | 39.06% | 60.94% |
| 90 | 1.1% | 36.95% | 63.05% |
| 95 | 1.1% | 34.97% | 65.03% |
| 100 | 1.1% | 33.08% | 66.92% |
(Source: DK Research Terminal, Ycharts)
1.1% annual net buybacks may not sound like much, but it adds up over time.
And buybacks are just the cherry on top of the VFC cake.
Reason Two: Great Growth Prospects For The Foreseeable Future
We’ve already seen how VFC is an industry leader in a $500+ billion market, with a potentially decades-long growth runway ahead of it. Here’s what analysts expect in the next few years.
VFC Medium-Term Growth Consensus Forecast
| Year | Sales | Free Cash Flow | EBITDA | EBIT (Operating Income) | Net Income |
| 2020 | $9,569 | $884 | $1,163 | $893 | $654 |
| 2021 | $11,209 | $923 | $1,651 | $1,373 | $1,076 |
| 2022 | $12,534 | $1,056 | $2,016 | $1,717 | $1,367 |
| 2023 | $13,477 | $1,231 | $2,160 | $1,886 | $1,511 |
| 2024 | $14,780 | $1,543 | $2,525 | $2,166 | $1,763 |
| 2025 | $15,675 | NA | $2,637 | $2,221 | $1,834 |
| Annualized Growth | 10.37% | 14.94% | 17.79% | 19.99% | 22.90% |
(Source: FactSet Research Terminal)
VFC’s growth is expected to be exceptional now that the pandemic is ending.
| Metric | 2020 Growth | 2021 Growth Consensus | 2022 Growth Consensus | 2023 Growth Consensus | 2024 Growth Consensus |
2025 Growth Consensus |
| Sales | 8% | -10% | 28% | 8% | 8% | 6% |
| Dividend | 12% | 2% | 2% (official) | 2% | 11% |
23% (53-year dividend growth streak) |
| EPS | -25% | -51% | 144% | 14% | 11% | 4% |
| Operating Cash Flow | -44% | 54% | -3% | 12% | 18% | NA |
| Free Cash Flow | -62% | 94% | -3% | 4% | 23% | NA |
| EBITDA | 28% | -22% | 30% | 12% | 6% | NA |
| EBIT (operating income) | -1% | -38% | 118% | 12% | 8% | NA |
(Source: FAST Graphs, FactSet Research Terminal)
VFC’s dividend growth is expected to start accelerating in 2024 and boom in 2025 as its payout ratio comes down.
And what about the long-term?
VFC Long-Term Growth Outlook
VFC’s consensus forecast is skewed by Deutsche Bank’s 44.5% CAGR long-term growth forecast.
- we’re using management 12% to 14% guidance
- most of VFC’s analyst growth forecasts are 12%, in line with management guidance
How accurate is management guidance?
- Smoothing for outliers historical analyst margins-of-error are 15% to the downside and 30% to the upside
- margin-of-error adjusted growth guidance range: 10% to 19% CAGR
- 70% statistical probability that VFC grows within this range
- excluding the pandemic, VFC’s historical growth rate is about 10.6% CAGR
Management and analysts think slightly faster growth is likely thanks to VFC’s strong brand building and great direct-to-consumer execution.
Reason Three: A Wonderful Company At A Wonderful Price
For the last 7 to 20 years, outside of bear markets and bubbles, tens of millions of investors have consistently paid between 17 and 22X earnings for VFC.
- 91% statistical probability that this range approximates intrinsic value
| Metric | Historical Fair Value Multiples (14-Years) | 2021 | 2022 | 2023 | 2024 | 2025 |
12-Month Forward Fair Value |
| 5-Year Average Yield | 2.47% | $78.14 | NA | NA | $90.69 | $111.34 | |
| 13-Year Median Yield | 2.28% | $84.65 | NA | NA | $98.25 | $120.61 | |
| 25- Year Average Yield | 2.47% | $78.14 | $80.97 | $80.97 | $90.69 | $111.34 | |
| Earnings | 19.67 | $53.70 | $69.24 | $77.50 | $91.47 | $94.81 | |
| Average | $71.39 | $74.65 | $79.20 | $92.67 | $108.69 | $76.05 | |
| Current Price | $57.63 | ||||||
|
Discount To Fair Value |
19.27% | 22.80% | 27.23% | 37.81% | 46.98% | 24.22% | |
|
Upside To Fair Value (NOT Including Dividends) |
23.87% | 29.53% | 37.42% | 60.80% | 88.60% | 31.96% (35.6% including dividend) | |
| 2022 EPS | 2023 EPS | 2022 Weighted EPS | 12-Month Forward EPS | 12-Month Average Fair Value Forward PE |
Current Forward PE |
||
| $3.52 | $3.92 | $1.21 | $3.64 | 20.9 | 15.8 |
I estimate VFC is worth about 21X earnings and today trades at just 15.8X, a 24% historical discount to fair value.
- no long-term investor in history
- who avoided becoming a forced seller for emotional or financial reasons
- has ever regretted buying VFC at under 16X earnings.
And guess what? Adjusted for cash VFC is trading at just 13.8X earnings, a PEG of just 1.1 based on management guidance.
This is Peter Lynch’s growth at a reasonable price and far below the company’s historical 2.2 PEG.
|
Analyst Median 12-Month Price Target |
Morningstar Fair Value Estimate |
| $73.06 (20.1 PE) | $68.00 (18.7 PE) |
|
Discount To Price Target (Not A Fair Value Estimate) |
Discount To Fair Value |
| 20.78% | 14.88% |
|
Upside To Price Target (Not Including Dividend) |
Upside To Fair Value (Not Including Dividend) |
| 26.23% | 17.48% |
|
12-Month Median Total Return Price (Including Dividend) |
Fair Value + 12-Month Dividend |
| $75.06 | $70.00 |
|
Discount To Total Price Target (Not A Fair Value Estimate) |
Discount To Fair Value + 12-Month Dividend |
| 22.89% | 17.31% |
|
Upside To Price Target (Including Dividend) |
Upside To Fair Value + Dividend |
| 29.68% | 20.94% |
Morningstar estimates that VFC has 21% upside to fair value and analysts expect it will deliver 30% returns in the next year.
Given its fundamentals, up to 36% total returns in the next year would be justified.
Of course, I don’t care about 12-month price targets, but only whether VFC’s margin of safety sufficiently compensates investors for its risk profile.
| Rating | Margin Of Safety For Low-Risk 13/13 Super SWAN quality companies | 2022 Price | 2023 Price |
12-Month Forward Fair Value |
| Potentially Reasonable Buy | 0% | $74.65 | $79.20 | $76.05 |
| Potentially Good Buy | 10% | $67.18 | $71.28 | $68.44 |
| Potentially Strong Buy | 20% | $59.72 | $63.36 | $60.84 |
| Potentially Very Strong Buy | 30% | $47.03 | $55.44 | $53.23 |
| Potentially Ultra-Value Buy | 40% | $44.79 | $47.52 | $45.63 |
| Currently | $57.88 | 22.46% | 26.92% | 23.89% |
| Upside To Fair Value (Not Including Dividends) | 28.97% | 36.83% | 31.39% |
For anyone comfortable with its risk profile VFC is a potentially strong buy and here’s why.
Total Return Potential That Can Help You Retire In Safety And Splendor
For context, here’s the return potential of the 14% overvalued S&P 500.
| Year | EPS Consensus | YOY Growth | Forward PE | Blended PE | Overvaluation (Forward PE) |
Overvaluation (Blended PE) |
| 2021 | $206.12 | 50.17% | 20.7 | 21.3 | 20% | 21% |
| 2022 | $226.19 | 9.74% | 19.9 | 20.3 | 16% | 15% |
| 2023 | $249.08 | 10.12% | 18.1 | 19.0 | 5% | 8% |
| 2024 | $275.28 | 10.52% | 16.3 | 17.2 | -5% | -2% |
| 12-Month forward EPS | 12-Month Forward PE | Historical Overvaluation | PEG | 25-Year Average PEG | S&P 500 Dividend Yield |
25-Year Average Dividend Yield |
| $233.83 | 19.358 | 14.88% | 2.28 | 3.62 | 1.44% | 2.01% |
(Source: DK S&P 500 Valuation And Total Return Tool)
Stocks have already priced in 94% EPS growth from 2020 through 2024 and are trading at 20X forward earnings.
- 16.85 is the 25-year average
- 16.9 is the 10-year average (low rate era)
- 16.9 is the 45-year average
- 91% probability that stocks are worth about 17X forward earnings
- A 13.0% correction needed to get back to the historical market fair value
S&P 500 2027 Consensus Return Potential
| Year | Upside Potential By End of That Year | Consensus CAGR Return Potential By End of That Year | Probability-Weighted Return (Annualized) | Inflation And Risk-Adjusted Expected Returns |
Expected Market Return Vs Historical Inflation-Adjusted Return |
| 2027 | 36.03% | 6.35% | 4.76% | 1.45% | 22.31% |
(Source: DK S&P 500 Valuation And Total Return Tool)
Adjusted for inflation, the risk-expected returns of the S&P 500 are about 1.5% for the next five years.
- 22% of the S&P’s historical inflation-adjusted returns of 6.5% CAGR
S&P 500 Interest Rate Adjusted Market Valuation
| S&P Earnings Yield | 10-Year US Treasury Yield | Earning Yield Risk-Premium (3.7% 10 and 20-year average) |
| 5.17% | 2.92% | 2.25% |
| Theoretical Interest Rate Justified Market Fair Value Forward PE | Current PE |
Theoretically Interest Rate Justified Market Decline |
| 15.10 | 19.33 | 21.88% |
(Source: DK S&P 500 Valuation And Total Return Tool)
Even adjusting for interest rates, stocks still require an even larger 22% correction before they become theoretically fairly valued.
But here’s what investors can reasonably expect if VFC grows as expected over the next five years.
- 5-year consensus return potential range: 13% to 21% CAGR
VFC 2024 Consensus Total Return Potential
(Source: FAST Graphs, FactSet) (Source: FAST Graphs, FactSet)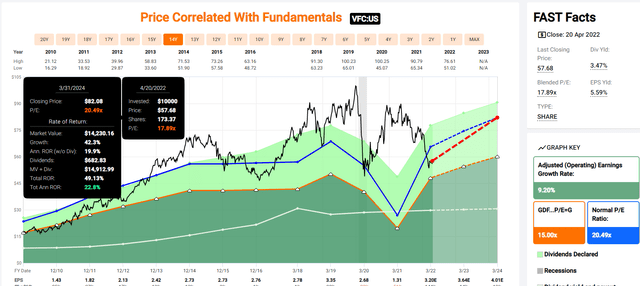
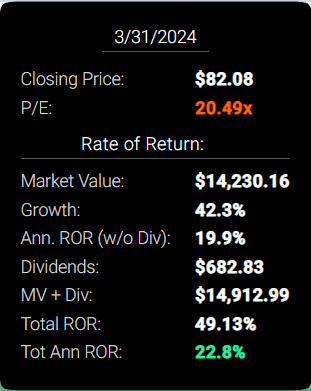
If VFC grows as expected and returns to historical fair value it could deliver 23% annual returns over the next two years.
- Buffett like-return potential from a blue-chip bargain hiding in plain sight
VFC 2027 Consensus Total Return Potential
(Source: FAST Graphs, FactSet) (Source: FAST Graphs, FactSet)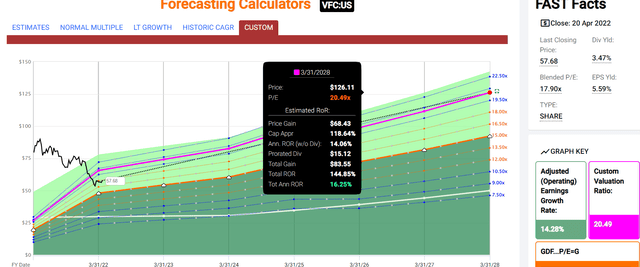
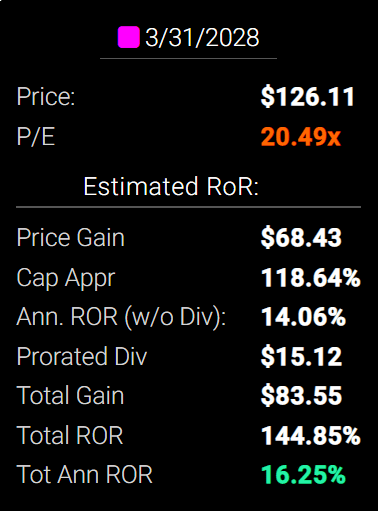
If VFC grows as fast as analysts and management expect then over the next five years it could deliver nearly 150% total returns or 16% annually.
- about 4X the S&P 500 consensus
VFC Investment Decision Score
DK (Source: DK Automated Investment Decision Tool)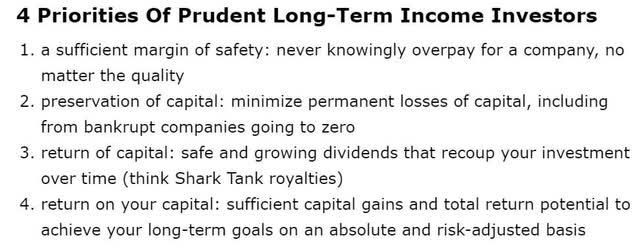
For anyone comfortable with its risk profile, VFC is as close to a perfect dividend king investment opportunity as exists on Wall Street.
- 24% discount vs 15% market premium
- far superior fundamental quality and safety
- 2.5X the much safer yield
- 67% better long-term return potential than the S&P 500
| Investment Strategy | Yield | LT Consensus Growth | LT Consensus Total Return Potential | Long-Term Risk-Adjusted Expected Return | Long-Term Inflation And Risk-Adjusted Expected Returns | Years To Double Your Inflation & Risk-Adjusted Wealth |
10 Year Inflation And Risk-Adjusted Return |
| Adam’s Planned Correction Buys | 3.9% | 18.9% | 22.8% | 16.0% | 13.5% | 5.3 | 3.54 |
| V.F Corp (Management Guidance) | 3.5% | 13.0% | 16.5% | 11.6% | 9.1% | 7.9 | 2.38 |
| Nasdaq (Growth) | 0.8% | 14.3% | 15.1% | 10.6% | 8.1% | 8.9 | 2.17 |
| High-Yield | 2.8% | 10.3% | 13.1% | 9.2% | 6.7% | 10.8 | 1.91 |
| Dividend Aristocrats | 2.2% | 8.9% | 11.1% | 7.8% | 5.3% | 13.6 | 1.67 |
| S&P 500 | 1.4% | 8.5% | 9.9% | 7.0% | 4.5% | 16.1 | 1.55 |
(Source: Morningstar, FactSet, Ycharts)
Management guidance is for VFC to deliver superior total returns than almost every popular strategy on Wall Street.
- higher yield than Vanguard’s high-yield ETF
- higher returns potential than the Nasdaq
- return potential that puts the aristocrats to shame
- and runs circles around the Nasdaq
VFC Inflation-Adjusted Total Return Potential: $1,000 Initial Investment
| Time Frame (Years) | 7.8% CAGR Inflation-Adjusted S&P Consensus | 8.9% Inflation-Adjusted Aristocrat Consensus | 14.3% CAGR VFC Guidance | Difference Between VFC Guidance And S&P |
| 5 | $1,453.07 | $1,531.58 | $1,961.15 | $508.07 |
| 10 | $2,111.43 | $2,345.73 | $3,846.09 | $1,734.66 |
| 15 | $3,068.06 | $3,592.68 | $7,542.74 | $4,474.68 |
| 20 | $4,458.12 | $5,502.47 | $14,792.41 | $10,334.29 |
| 25 | $6,477.98 | $8,427.47 | $29,010.06 | $22,532.08 |
| 30 | $9,412.99 | $12,907.33 | $56,892.93 | $47,479.94 |
(Source: DK Research Terminal, FactSet)
If management can deliver its growth guidance for a decade that’s a potential 4X inflation-adjusted return. If it can deliver that growth for 30 years, then VFC is potentially your ticket to a rich retirement.
| Time Frame (Years) | Ratio Aristocrats/S&P | Ratio VFC Guidance and S&P |
| 5 | 1.05 | 1.35 |
| 10 | 1.11 | 1.82 |
| 15 | 1.17 | 2.46 |
| 20 | 1.23 | 3.32 |
| 25 | 1.30 | 4.48 |
| 30 | 1.37 | 6.04 |
(Source: DK Research Terminal, FactSet)
Long-term we’re talking about the potential to outperform the S&P 500 by 6X while enjoying safer, higher, and faster-growing dividends.
Risk Profile: Why V.F Corp Isn’t Right For Everyone
There are no risk-free companies and no company is right for everyone. You have to be comfortable with the fundamental risk profile.
VFC Risk Profile Includes
- economic cyclicality risk: sales could suffer in a recession
- M&A risk: the lifeblood of the VF’s long-term growth strategy
- margin compression risk: over 1,000 major rivals globally
- disruption risk from digital commerce: DTC is doing well but could suffer from wholesale sales declines if retail partners close stores
- labor retention risk (tightest job market in over 50 years and finance is a high paying industry) – rising wage pressures
- currency risk (growing over time due to international expansion)
- inflation risk: supply chain disruption and higher input costs have recently hurt margins
- shifting consumer taste risk: activewear has been red hot (VANs), but if consumer tastes shift then management growth guidance could fall short
How do we quantify, monitor, and track such a complex risk profile? By doing what big institutions do.
Material Financial ESG Risk Analysis: How Large Institutions Measure Total Risk
- 4 Things You Need To Know To Profit From ESG Investing
- What Investors Need To Know About Company Long-Term Risk Management (Video)
Here is a special report that outlines the most important aspects of understanding long-term ESG financial risks for your investments.
- ESG is NOT “political or personal ethics based investing”
- it’s total long-term risk management analysis
ESG is just normal risk by another name.” Simon MacMahon, head of ESG and corporate governance research, Sustainalytics” – Morningstar
ESG factors are taken into consideration, alongside all other credit factors, when we consider they are relevant to and have or may have a material influence on creditworthiness.” – S&P
ESG is a measure of risk, not of ethics, political correctness, or personal opinion.
S&P, Fitch, Moody’s, DBRS (Canadian rating agency), AMBest (insurance rating agency), R&I Credit Rating (Japanese rating agency), and the Japan Credit Rating Agency have been using ESG models in their credit ratings for decades.
- credit and risk management ratings make up 41% of the DK safety and quality model
- dividend/balance sheet/risk ratings make up 82% of the DK safety and quality model
Dividend Aristocrats: 67th Industry Percentile On Risk Management (Above-Average, Medium Risk)
VFC Long-Term Risk Management Consensus
| Rating Agency | Industry Percentile |
Rating Agency Classification |
| MSCI 37 Metric Model | 82.0% |
AA Industry Leader – Stable Trend |
| Morningstar/Sustainalytics 20 Metric Model | 88.8% |
12.7/100 Low-Risk |
| Reuters’/Refinitiv 500+ Metric Model | 88.2% | Good |
| S&P 1,000+ Metric Model | 28.0% |
Average- Stable Trend |
| Just Capital 19 Metric Model | 88.89% | Excellent |
| FactSet | 50.0% |
Average- Positive Trend |
| Consensus | 71% | Good |
(Sources: MSCI, Morningstar, Reuters’, Just Capital, S&P, FactSet Research)
VFC Long-Term Risk Management Is The 185th Best In The Master List (63rd Percentile)
- master list average: 62nd percentile
- dividend kings: 63rd percentile
- aristocrats: 67th percentile
- Ultra SWANs: 71st percentile
VFC’s risk-management consensus is in the bottom top 37% of the world’s highest quality companies and similar to that of such other companies as
- United Parcel Service (UPS)
- West Pharmaceutical Services (WST) – dividend champion
- Ecolab (ECL) – dividend aristocrat
- Kimberly-Clark (KMB) – dividend aristocrat
- Alphabet (GOOG)
The bottom line is that all companies have risks, and VFC is good at managing theirs.
How We Monitor VFC’s Risk Profile
- 25 analysts
- 2 credit rating agencies
- 7 total risk rating agencies
- 32 experts who collectively know this business better than anyone other than management
- and the bond market for real-time fundamental risk analysis
When the facts change, I change my mind. What do you do sir?” – John Maynard Keynes
There are no sacred cows at iREIT or Dividend Kings. Wherever the fundamentals lead we always follow. That’s the essence of disciplined financial science, the math behind retiring rich and staying rich in retirement.
Bottom Line: V.F Corp Is One Of The Best Dividend Aristocrat Bargains You Can Buy
There’s nothing like trusting the world’s best companies to achieve your long-term financial goals.
The only thing better than that?
- buying low-risk Ultra SWANs
- that are dividend kings
- have an A-credit rating are growing at 13%
- and trading at 24% historical discounts
- 13.8X cash-adjusted earnings
- and yielding a very safe 3.5%
V.F Corp is a classic Buffett-style “wonderful company” but it’s not trading at a fair price, but a wonderful price.
VFC is an example of how to take advantage of the market volatility that causes some to run for the hills.
Today VFC isn’t just one of the best high-yield aristocrats you can safely buy for the long-term, it’s one of the best companies you can buy…period.
A company that can help you make your own long-term luck on Wall Street and potentially retire in safety and splendor.
