

Bitcoin (BTC) Charts and Analysis:
- The longer-term downtrend is broken and two simple moving averages look supportive.
- ETH/BTC jumps higher giving the alt-coin market a positive backdrop.
Recommended by Nick Cawley
Get Your Free Bitcoin Forecast
Bitcoin has broken higher over the last 24 hours and is testing a prior resistance level around $20.475k that has weighed on BTC over the 10 weeks. The recent break, and confirmation, of the medium-term downtrend, have helped to drive the move after BTCUSD got stuck in a multi-month sideways range. I noted the break and reason for optimism earlier this month:
Bitcoin (BTC) Latest: A False Break or a Reason to be Optimistic
While the recent move higher may have more room to run higher, it will need to break through a recent zone between $22.8k and $25.2k. A confirmed break through this zone would also take out the last two lower highs and the last of the three simple moving averages, the 200-dsma. This would change Bitcoin’s outlook to positive and leave further upside on the cards.
Bitcoin (BTC/USD) Daily Price Chart – October 26, 2022
Chart via TradingView
While the technical outlook may be starting to turn, the fundamental outlook may still weigh on Bitcoin. US interest rates will be raised by 75 basis points at the next FOMC meeting, and nearly certainly by the same amount again at the December meeting, keeping the macro environment negative. Saying that yesterday saw the Nasdaq and Bitcoin diverge, giving the crypto-bulls more reason to be cheerful. Higher interest rates weigh on the Nasdaq.
The second-largest coin by market cap, Ethereum (ETH), is also running higher and is out-performing Bitcoin over the last week. The ETH/BTC spread is seen by some as a marker for alt-coin performance with a rallying spread leading to higher alt-coin prices and a potential to outperform Bitcoin. The ETH/BTC spread is now back above all three simple moving averages and a potential ‘golden cross’ is being formed. This set-up, when the 50-day sma moves above the 200-day sma, is seen by many as a bullish signal.
ETH/BTC Daily Chart – October 26, 2022
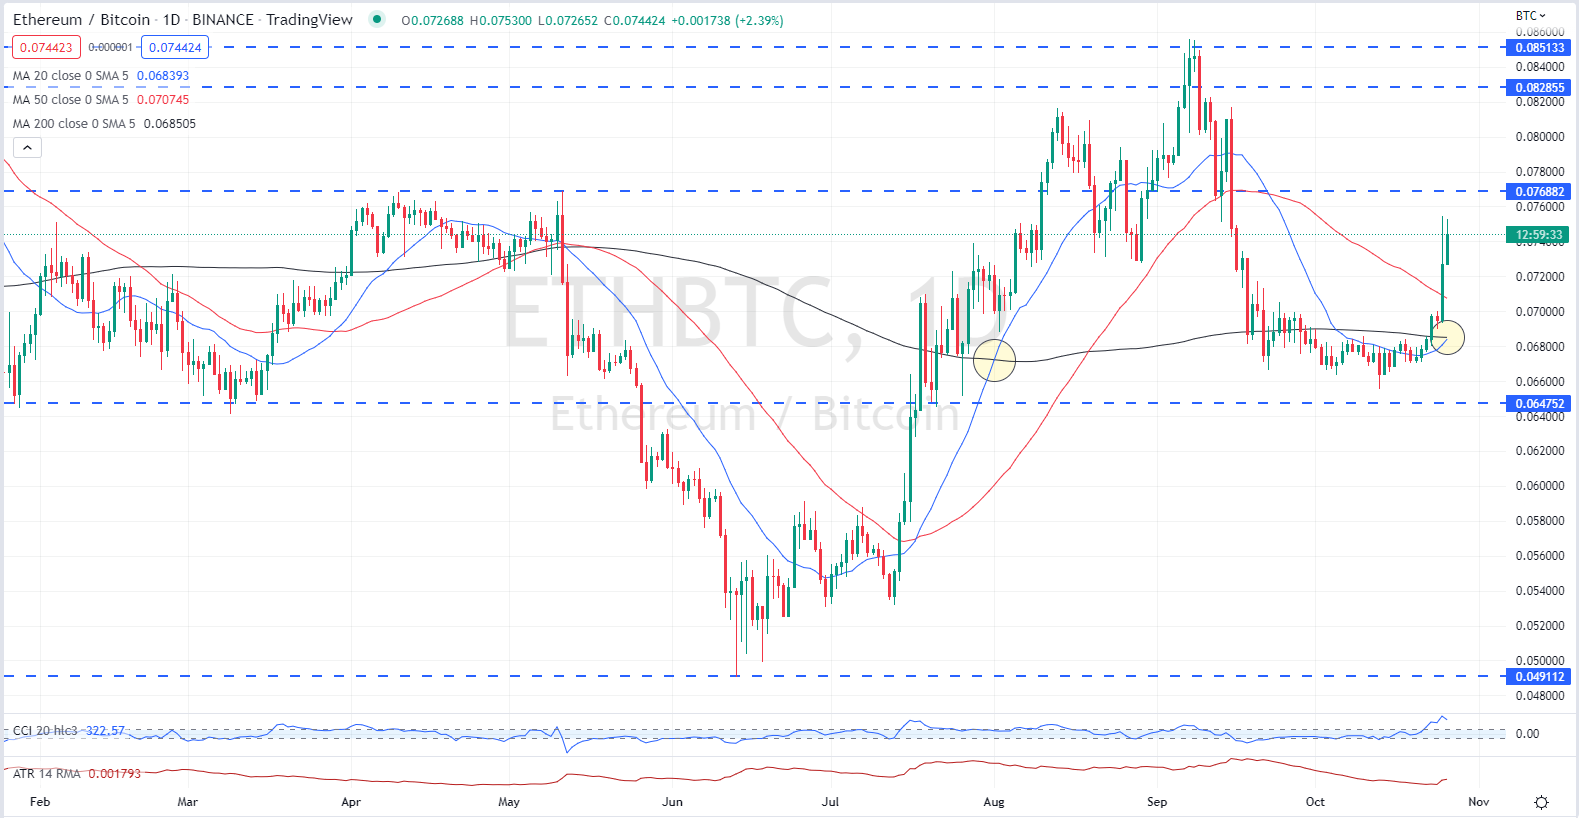
Chart via TradingView
What is your view on Bitcoin – bullish or bearish?? You can let us know via the form at the end of this piece or you can contact the author via Twitter @nickcawley1.

