When your forex trading adventure begins, you’ll likely be met with a swarm of different methods for trading. However, most trading opportunities can be easily identified with just one of four chart indicators. Once you know how to use the Moving Average, RSI, Stochastic, & MACD indicator, you’ll be well on your way to executing your trading plan like a pro. You’ll also be provided with a free reinforcement tool so that you’ll know how to identify trades using these forex indicators every day.
Find the best trading ideas and market forecasts from DailyFX.
The Benefits of a Simple Strategy
Traders tend to overcomplicate things when they’re starting out in the forex market. This fact is unfortunate but undeniably true. Traders often feel that a complex trading strategy with many moving parts must be better when they should focus on keeping things as simple as possible. This is because a simple strategy allows for quick reactions and less stress.
If you’re just getting started, you should seek the most effective and simple strategies for identifying trades and stick with that approach.
Starts in:
Live now:
Oct 31
( 02:10 GMT )

Simplify a strategy using directional indicators
Cross-Market Weekly Outlook
Discover the Best Forex Indicators for a Simple Strategy
One way to simplify your trading is through a trading plan that includes chart indicators and a few rules as to how you should use those indicators. In keeping with the idea that simple is best, there are four easy indicators you should become familiar with using one or two at a time to identify trading entry and exit points:
- Moving Average
- RSI (Relative Strength Index)
- Slow Stochastic
- MACD
Once you are trading a live account a simple plan with simple rules will be your best ally.
Using Forex Indicators to Read Charts for Different Market Environments
There are many fundamental factors when determining the value of a currency relative to another currency. Many traders opt to look at the charts as a simplified way to identify trading opportunities – using forex indicators to do so.
When looking at the charts, you’ll notice two common market environments. The two environments are either ranging markets with a strong level of support and resistance, or floor and ceiling that price isn’t breaking through or a trending market where price is steadily moving higher or lower.
Using technical analysis allows you as a trader to identify range bound or trending environments and then find higher probability entries or exits based on their readings. Reading the indicators is as simple as putting them on the chart.
Trading with Moving Averages
One of the best forex indicators for any strategy is moving average. Moving averages make it easier for traders to locate trading opportunities in the direction of the overall trend. When the market is trending up, you can use the moving average or multiple moving averages to identify the trend and the right time to buy or sell.
The moving average is a plotted line that simply measures the average price of a currency pair over a specific period of time, like the last 200 days or year of price action to understand the overall direction.
Learn Forex: GBPUSD Daily Chart – Moving Average
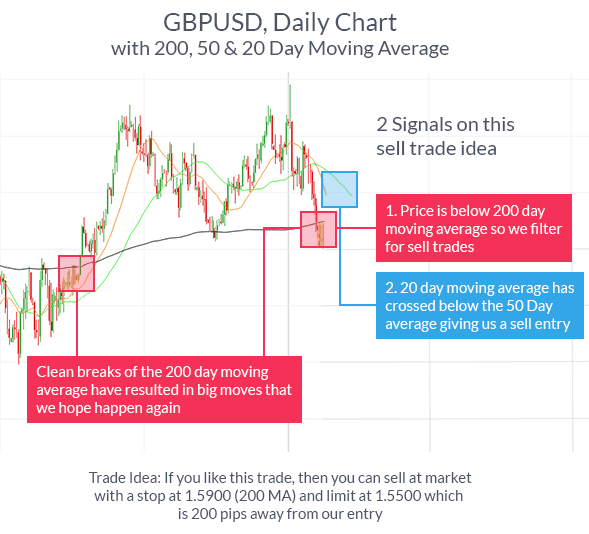
You’ll notice a trade idea was generated above only with adding a few moving averages to the chart. Identifying trade opportunities with moving averages allows you see and trade off of momentum by entering when the currency pair moves in the direction of the moving average, and exiting when it begins to move opposite.
Trading with RSI
The Relative Strength Index or RSI is an oscillator that is simple and helpful in its application. Oscillators like the RSI help you determine when a currency is overbought or oversold, so a reversal is likely. For those who like to ‘buy low and sell high’, the RSI may be the right indicator for you.
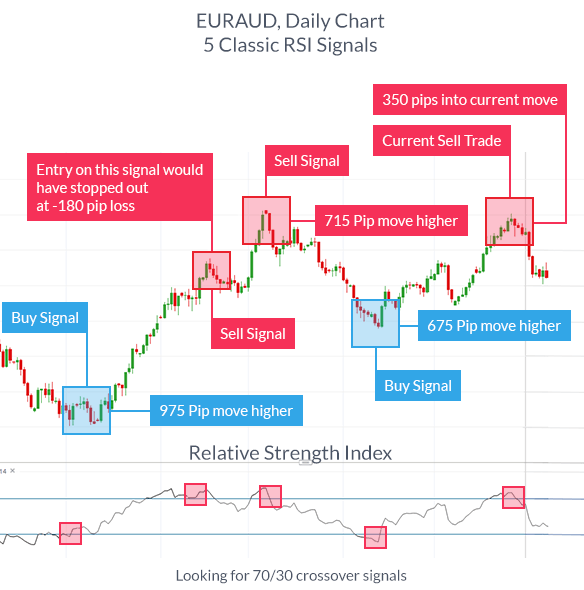
The RSI can be used equally well in trending or ranging markets to locate better entry and exit prices. When markets have no clear direction and are ranging, you can take either buy or sell signals like you see above. When markets are trending, it becomes more obvious which direction to trade (one benefit of trend trading) and you only want to enter in the direction of the trend when the indicator is recovering from extremes.
Because the RSI is an oscillator, it is plotted with values between 0 and 100. The value of 100 is considered overbought and a reversal to the downside is likely whereas the value of 0 is considered oversold and a reversal to the upside is commonplace. If an uptrend has been discovered, you would want to identify the RSI reversing from readings below 30 or oversold before entering back in the direction of the trend.
Trading with Stochastics
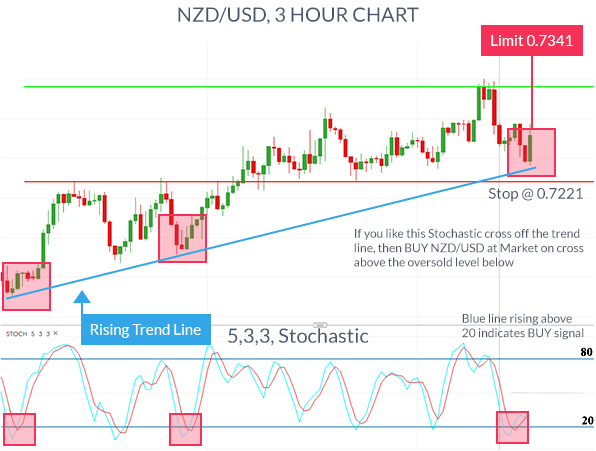
Slow stochastics are an oscillator like the RSI that can help you locate overbought or oversold environments, likely making a reversal in price. The unique aspect of trading with the stochastic indicator is the two lines, %K and %D line to signal our entry.
Because the oscillator has the same overbought or oversold readings, you simply look for the %K line to cross above the %D line through the 20 level to identify a solid buy signal in the direction of the trend.
Trading with the Moving Average Convergence & Divergence (MACD)
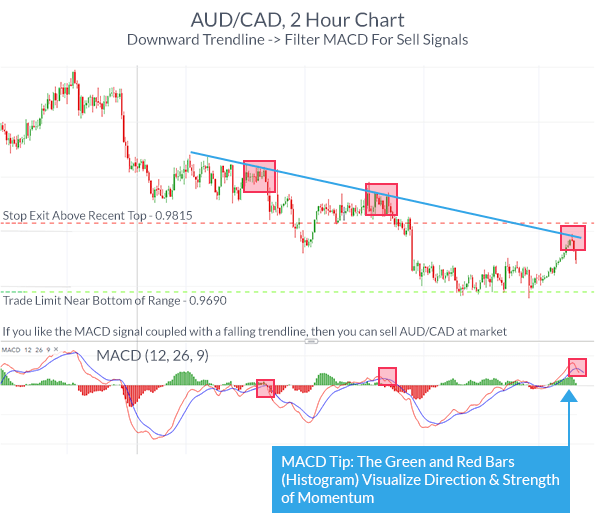
Sometimes known as the king of oscillators, the MACD can be used well in trending or ranging markets due to its use of moving averages provide a visual display of changes in momentum.
After you’ve identified the market environment as either ranging or trading, there are two things you want to look for to derive signals from this indictor. First, you want to recognize the lines in relation to the zero line which identify an upward or downward bias of the currency pair. Second, you want to identify a crossover or cross under of the MACD line (Red) to the Signal line (Blue) for a buy or sell trade, respectively.
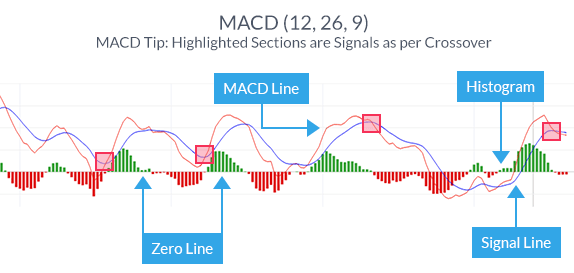
Like all indicators, the MACD is best coupled with an identified trend or range-bound market. Once you’ve identified the trend, it is best to take crossovers of the MACD line in the direction of the trend. When you’ve entered the trade, you can set stops below the recent price extreme before the crossover, and set a trade limit at twice the amount you’re risking.
Learn More about Forex Trading with our Free Guides
If you’re looking to boost your forex trading knowledge even further, you might want to read one of our free trading guides. These in-depth resources cover everything you need to know about learning to trade forex such as how to read a forex quote, planning your forex trading strategy and becoming a successful trader.
You can also sign up to our free webinars to get daily news updates and trading tips from the experts.
Happy trading!
Next: How to Read a Moving Average (41 of 63)
Previous: An Indicator Has No Concept of Trend
You might be interested in…
– 3 things I wish I knew when I started trading forex
– The basics of how money is made trading forex


