

USD/JPY Price and Chart Analysis
- USD/JPY breaks above 149.00 as US Treasury yields remain in control.
- Finance Minister warns about ‘excessive moves’.
Recommended by Nick Cawley
Get Your Free JPY Forecast
The Japanese Yen continues to weaken against the US dollar and earlier in the session traded at lows last seen in August 1990. Little has changed for the Yen with Japanese officials seemingly willing to let the currency weaken further by capping bond yields. The 10-year JGB yield is capped at 0.25%. In contrast, US Treasury yields continue to trade at, or near, multi-year highs as the Fed continues to ramp up interest rates. The rate-sensitive 2-year UST trades with a yield of around 4.45%, while the benchmark 10-year UST is quoted with a yield of 4.00%, around 375 basis points higher than the equivalent JGB.
US Treasury 10-Year Yield Monthly Chart October 18, 2022
Chart via TradingView
Bank of Japan (BoJ) – Foreign Exchange Market Intervention
The recent moves in USD/JPY have prompted Japanese Finance Minister Shunichi Suzuki to warn of potential intervention to calm excessive moves in the FX market. Suzuki said that authorities are ‘closely watching market moves’ and that they would make an ‘appropriate’ response to calm excessive volatility at any time. The BoJ intervened in the market last month, selling USD/JPY, but their actions failed to stem the ongoing weakness in the pair. With the psychological level of 150 within touching distance, and with the yield spread between the two currencies widening further, the markets may soon test the Finance Minister’s resolve.
Trade Smarter – Sign up for the DailyFX Newsletter
Receive timely and compelling market commentary from the DailyFX team
Subscribe to Newsletter
USD/JPY Daily Price Chart – October 18, 2022
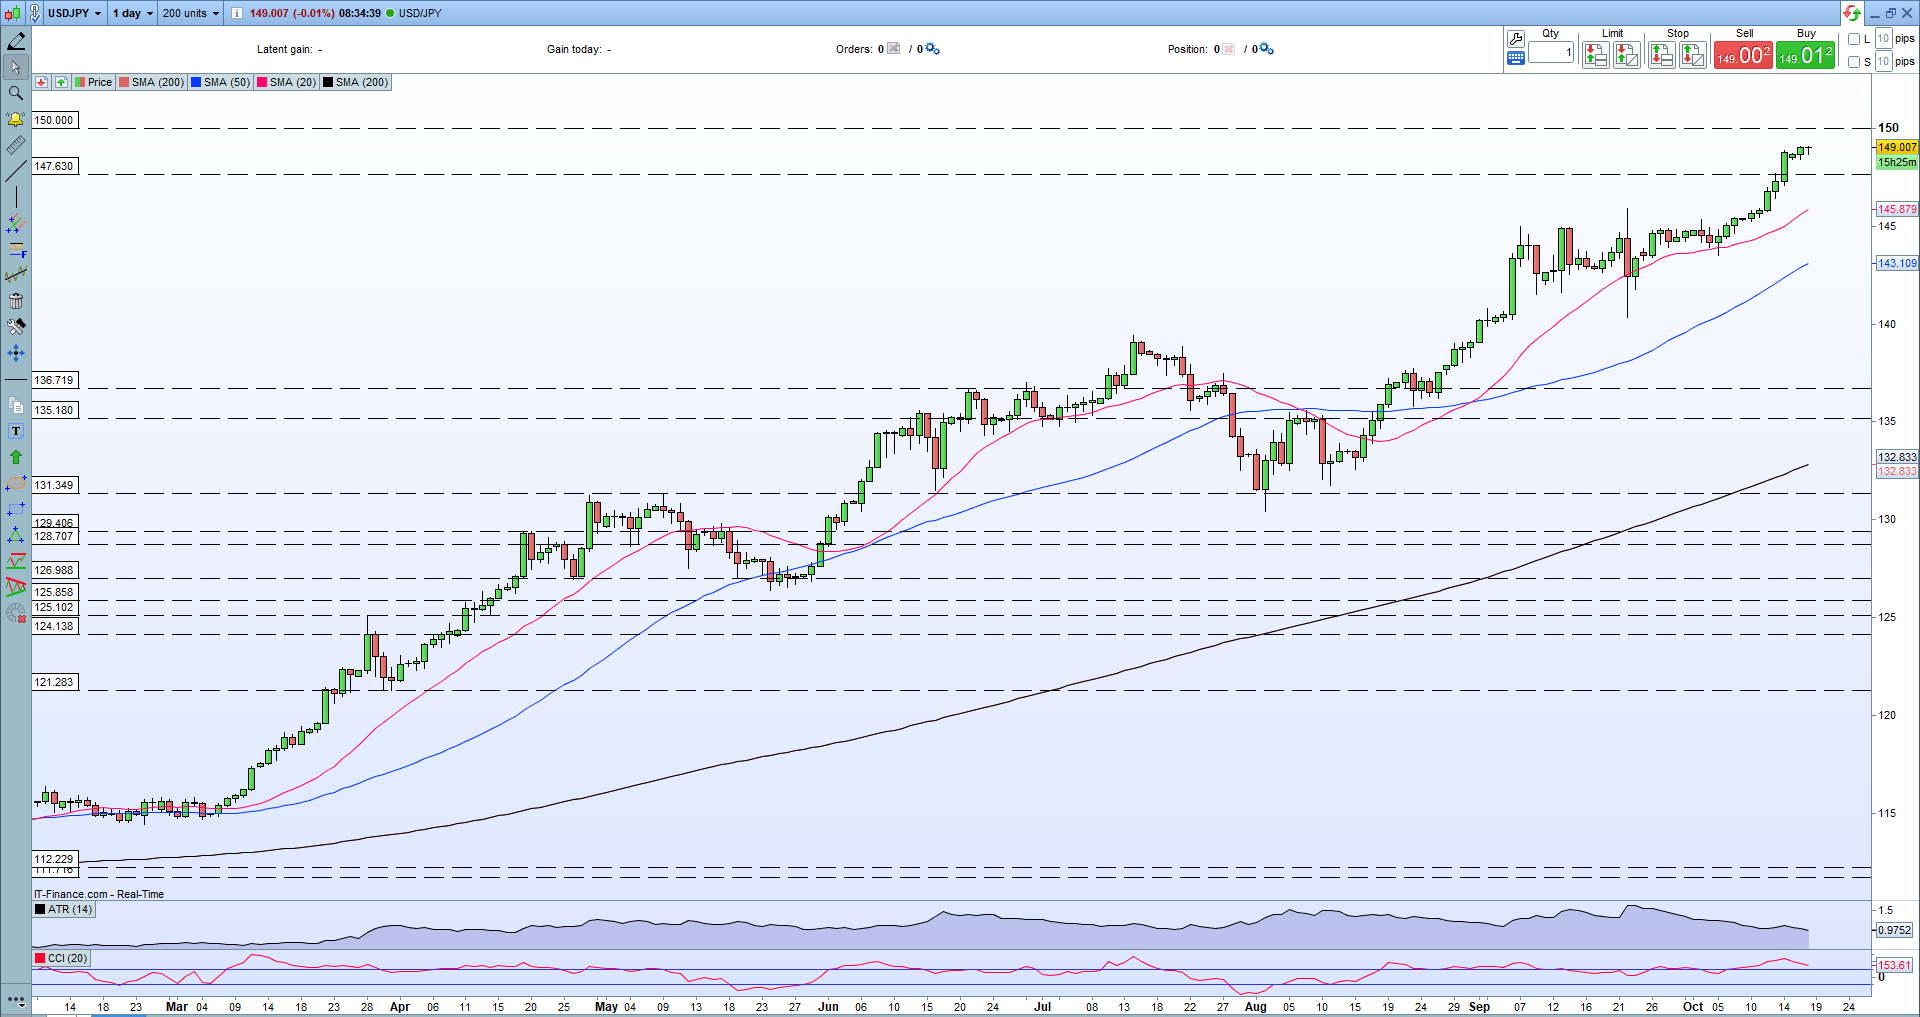
For all market-moving data releases and economic events see the real-time DailyFX Calendar.
Retail trader data show that 18.31% of traders are net-long with the ratio of traders short to long at 4.46 to 1.The number of traders net-long is 11.53% higher than yesterday and 5.84% lower from last week, while the number of traders net-short is 5.23% higher than yesterday and 9.20% higher from last week.
We typically take a contrarian view to crowd sentiment, and the fact traders are net-short suggests that USD/JPY prices may continue to rise. Positioning is less net-short than yesterday but more net-short from last week. The combination of current sentiment and recent changes gives us a further mixed USD/JPY trading bias.
| Change in | Longs | Shorts | OI |
| Daily | 7% | 5% | 5% |
| Weekly | -8% | 12% | 7% |
What is your view on the USD/JPY – bullish or bearish?? You can let us know via the form at the end of this piece or you can contact the author via Twitter @nickcawley1.
