

Gold Talking Points:
Recommended by James Stanley
Download our Gold Forecast
It was a rough month of September for Gold prices, as a combination of higher rates and USD-strength helped to bring on a break of a long-term double top formation. Gold prices ranged for more than two years with a build of support in the 1680-1700 zone that held through multiple inflections and that finally started to give way last month.
But, like many sticky zones of long-term support, it remains in the equation as a late-month pullback has pushed prices back into that area which remains in-play this morning.
Gold Monthly Price Chart
Chart prepared by James Stanley; Gold on Tradingview
Gold Daily
From the daily chart we can put this recent pullback into scope. Price found resistance at a bearish trendline connecting April and August swing highs. That trendline held as resistance over a three-day-period last week before sellers started to take-control again.
Initially, price pushed down to the 1700 psychological level and found a bit of support, but that move continued into this week with prices putting in yet another test of the bottom of the zone at 1671. Bears weren’t able to get much further than that, however, threatening the prospect of a higher-low if bulls can hold short-term support around the current spot on the chart.
Gold Daily Price Chart
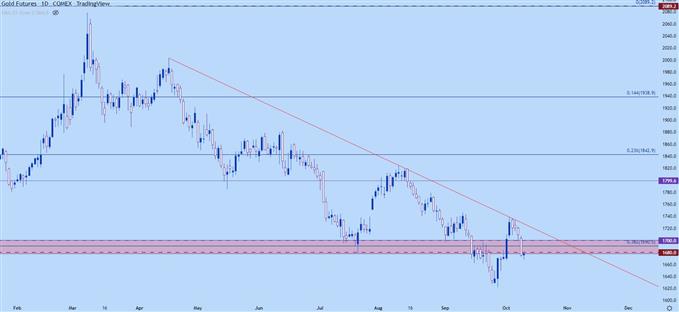
Chart prepared by James Stanley; Gold on Tradingview
Gold Near-Term Strategy
As I’ve been discussing in these gold articles of late, bearish breakout strategies have appeared especially challenging as there’s been a litany of false downside breakouts in Gold. More attractive, however, is waiting for some element of resistance to show up which, at the very least, could offer some parameters for risk management.
From the four-hour chart below, we can put some scope on this recent pullback move with the help of a Fibonacci retracement. The 1680 has been a key point of support for some time and that’s also the 50% marker of the recent bounce. A break-above that level opens the door for a move up to next resistance, plotted from 1690-1694. Above that is the 1700 psychological level, which helped to set support in Gold around last week’s close.
That’s a lot of overhead resistance, and if bulls can clear this then we’ll likely be seeing some softening in the rates theme, at which point next resistance can be cast a little further out, with levels at 1711, 1727 and 1738 showing some element of relevancy.
On the underside of price action – a push-below 1666 indicates a failure from bulls and this re-opens the door for bearish trend strategies, with next supports at the 1647-1650 zone.
Gold Four-Hour Price Chart
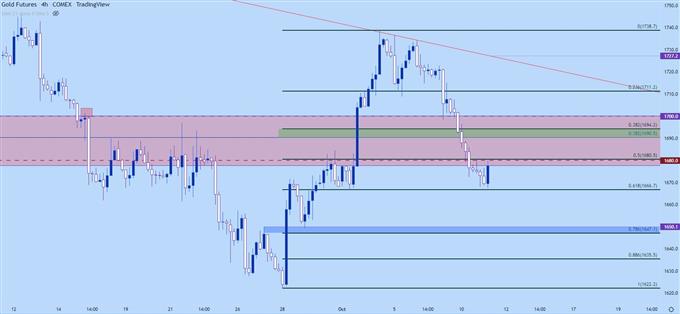
Chart prepared by James Stanley; Gold on Tradingview
— Written by James Stanley, Senior Strategist, DailyFX.com & Head of DailyFX Education
Contact and follow James on Twitter: @JStanleyFX
