

Australian Dollar, AUD/USD, Consumer Confidence, Technical Outlook – Talking Points
- Asia-Pacific markets set for a move lower after downbeat US trading session
- Geopolitical tensions rising, complicating Fed path as commodity prices rise
- AUD/USD breaks to a fresh multi-year low and looks ready for more losses
Recommended by Thomas Westwater
Get Your Free AUD Forecast
Tuesday’s Asia-Pacific Outlook
Asia-Pacific markets look ready to extend an overnight market slide. The S&P 500 and Dow Jones Industrial Average posted losses of 0.75% and 0.32% at the closing bell. An escalation in geopolitical tensions stemming from the situation in Ukraine and Russia’s stepped-up attacks that have reportedly targeted several cities, including Kyiv, are putting traders in a cautious stance.
The United States published a broad list of export controls late last week. The Biden administration’s move specifically targets China’s ability to access US-born semiconductors. It is perhaps the highest-profile move against China since the US-China trade war started in 2018. It also signals another escalation in the strained US-China relationship.
Grain markets most notably reflected the rising fears that an agreement to secure Black Sea exports made earlier this year may be reversed. Wheat futures trading in Chicago surged by more than 6% in the current contract. Corn, soybeans, and cotton prices were higher as well, despite a strong US Dollar. Gold and silver prices fell against higher nominal and real yields.
Australian consumer confidence data from Westpac for October and August final building permits are on today’s calendar. The Japanese Eco Watchers Survey for September is another in-focus data point for today. Later this week, Chinese credit and inflation data are due, providing the latest picture on efforts by Chinese policymakers to boost economic growth amid deteriorating financial conditions cause by rising rates abroad. September new Yuan loans are seen rising to 1.8 trillion.
Discover what kind of forex trader you are
Australian Dollar Technical Outlook
AUD/USD is trading at the lowest level since April 2020 after a 1% overnight drop. The MACD, on a weekly basis, is picking up downward momentum, with the daily timeframe showing a similar picture. Prices look ready to continue falling deeper into early 2020 levels over the short term, with little notable resistance since that time.
AUD/USD Daily Chart
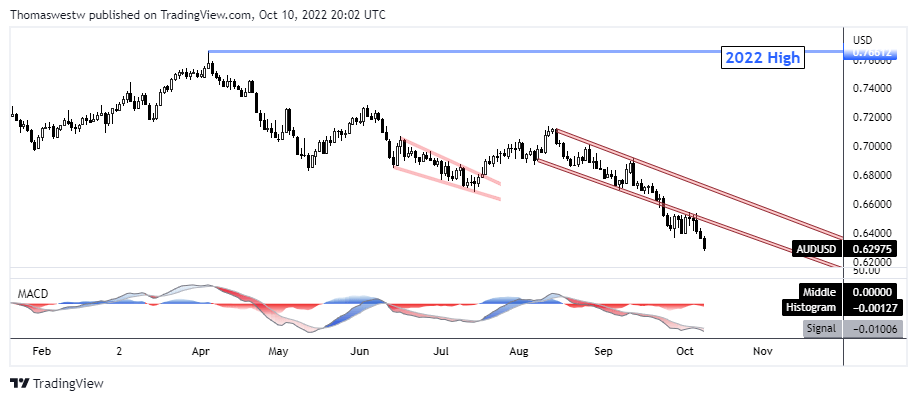
Chart created with TradingView
— Written by Thomas Westwater, Analyst for DailyFX.com
To contact Thomas, use the comments section below or @FxWestwater on Twitter

