

Standard Support and Resistance
In order to properly introduce the supply and demand concept, it is important to analyze a widely known similar notion: Support and Resistance. Many traders are using these areas of support and resistance in their technical analysis, as it plays a key role in their trading approach.
Levels for Support and Resistance
Support, or a support level, refers to the price level that an asset does not fall below for a period of time. An asset’s support level is created by buyers entering the market whenever the asset dips to a lower price.
Resistance, or a resistance level, is the area at which the price of an asset meets pressure on its way up by the emergence of a growing number of sellers who wish to sell at that price. Lots of selling orders are being placed, which drive the price level or lower.
Once a price is reaching key support and resistance levels, traders are looking for an entry point or to exit their current trades, locking in their profits. The main reason is that at these levels, price will either break the support/resistance area or bounce from it.
In the above picture, we can see that the price is constantly having difficulties breaking the level around 0.99055. That level is considered a support as the price bounces back each time that level is hit.
Support and resistance levels are not always static. They can be dynamic levels, in the form of trend lines, moving averages, price channels and so on. The principles remain the same with regards to where the price is rejected and buying or selling pressure is applied by the market.
Trend lines
A trend is the overall direction of an asset’s price. When performing technical analysis, trends are identified by lines that highlight when the price is making higher highs and higher lows for an uptrend, or lower lows and lower highs for a downtrend. These lines act as dynamic support and resistance and provide signals for when to enter or exit a trade.
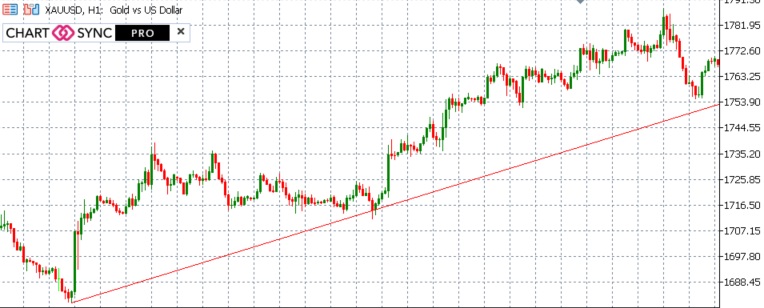
For example, when a market is trending up, resistance may form when there is a consistent profit-taking among buyers, which place sell orders to close their buying positions. This process leads to a pullback, forming a conclusive high of the move. However, when the price drops, buyers will look for opportunities to re-enter the market when the price reaches the supporting trend line.
All static and dynamic support & resistance levels may be drawn on different timeframes. The higher the timeframe, the more important the level. Short term traders may look at M5-M15 price moves, but they should also take into account the upper timeframe levels H4 or Daily, as they are of bigger importance and may lead to more substantial buying or selling pressure from the market.
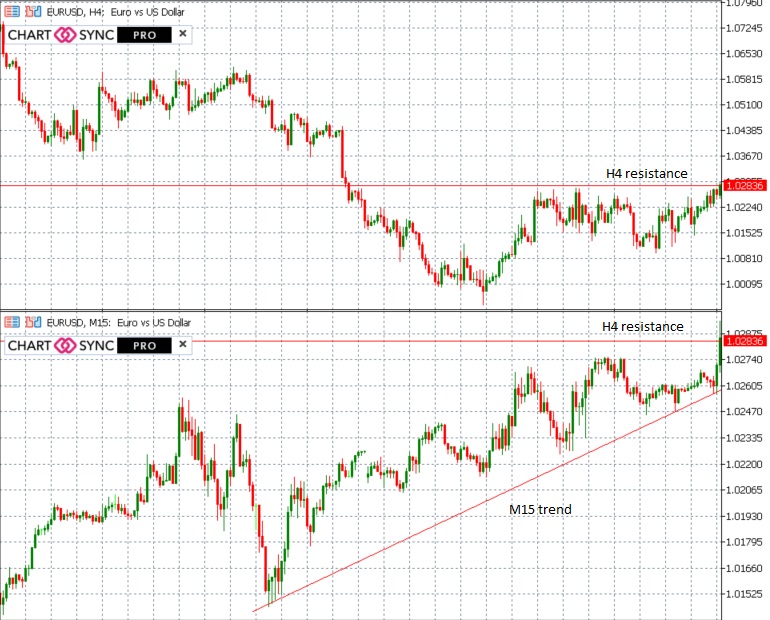
In the picture above, the price action on the M15 time frame depicts a potential upper move supported by the M15 upper trend line. However, the resistance level on the H4 timeframe acts as a big warning towards entering with a buy position, as selling pressure might be considerably larger when reaching that level.
Drawbacks of using support and resistance
- Missing good trades or entering bad ones. First of all, these levels should not be considered as lines, they should be looked at as areas. Price could break and bounce back several times around a specific line represented level, which brings a lot of chaos. Second, placing limit orders around these levels may result in either entering a bad trade (when false breakouts occur that hit the pending order) or missing a good trade (if the order was placed too close to the level and the price returned before that level was hit)
- Lagging signal. Using indicators like Moving Average as dynamic support and resistance provides a delayed feedback to the traders. The underlying mathematical formula of this type of indicator shows that the calculated value is always behind the price, therefore it cannot be used to predict the future move.
The traditional support and resistance levels should always be used as confirmation signals, never as triggers for entering a trade. Proper analysis around key price levels should be made using supply and demand techniques, which reveals the momentum behind each price movement and helps us make the best trading decisions.
In the following posts I will continue to talk about supply and demand, how we can efficiently identify the moves and apply all the knowledge to increase the market edge.
///

