

S&P 500, FTSE 100, Inflation, Rate Forecasts and EURUSD Talking Points:
- The Market Perspective: USDJPY Bearish Below 141.50; Gold Bearish Below 1,680
- The FTSE 100 Rebound After the BOE’s Emergency Program Announcement Reversed this Past Session, So It Comes as No Surprise the SPX Suffered the Same Fate
- While risk trends remain a key focus moving forward, top event risk is drawing my attention to EURUSD in particular between Eurozone and US inflation figures
Recommended by John Kicklighter
Get Your Free Top Trading Opportunities Forecast
FTSE 100 Falters Despite Direct Intervention, S&P 500 Another Low Without a Break
The rebound in risk assets through the middle of the week fell apart quickly. Considering there wasn’t much in the way of tangible support for bulls to grasp onto beyond the surprise Bank of England (BOE) bond purchase program, the loss of traction isn’t particularly surprising. With a run of high profile scheduled event risk ahead, we may very well find a final burst of volatility before the week ends. Considering we are also closing out the month and quarter, the environment may be even further warped and prone to volatility. With that eddy in market conditions, it is perhaps fitting that the S&P 500 wouldn’t truly commit in its slide this past session. The benchmark index did drop -2.1 percent on the day to fully reverse Wednesday’s climb and it ultimately posted its lowest close since November 2020. However, the move doesn’t host the kind of progress that a technician would usually label a genuine ‘break’. Once again, we are on a technical precipice with plenty of fundamental wind but a limited timeline in which to work through the convolution.
Chart of S&P 500 20-Day SMA with 20-Day Disparity and 1-Day ROC (Daily)
Chart Created on Tradingview Platform
When it comes to speculative representation, the S&P 500 is arguably among the most influential; but I am paying particular attention to the performance of the UK benchmark FTSE 100 given the connection to the BOE’s direct support. The aim of the central bank’s support is to curb long-dated bond yields, but the ‘relief from crisis’ can also play the role of a spark for speculative appetites. What was notable – and perhaps troubling for opportunistic bulls – was the FTSE 100’s tumble through Thursday’s session. The -1.8 percent drop erased most of the post-BOE announcement rally (producing Wednesday’s ‘lower wick’) and ultimately pushed the index to its lowest close since July 2021. Similar to the US indices, this market measure is resting just above an establish support; but the 6,820/6,840 range support carries far more technical weight than anything we are seeing on the S&P 500 or Dow.
Chart of UK 100 with 20 SMA, 20-Day Disparity and 1-Day ROC (Daily)
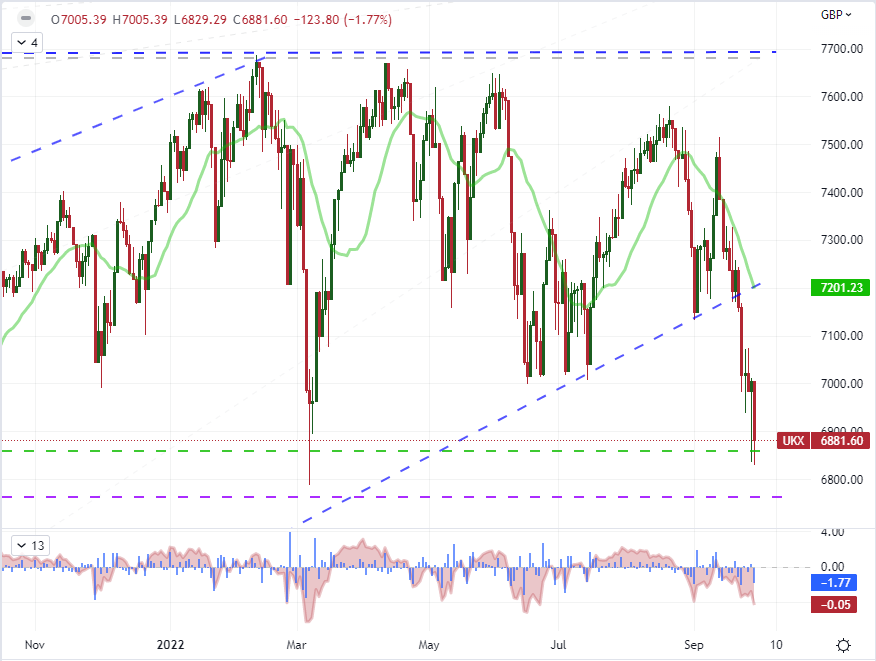
Chart Created on Tradingview Platform
Seasonal Influences and Top Event Risk
Typically, when I am making reference to seasonal influences, it is around a period that stretches over multiple weeks or even months. However, there are norms that unfold over a much shorter duration. In the typical week, for example, there is a material drop off in liquidity through the final 12 hours of Friday trade. That can create distortions, such as a curtailed response to Friday US releases like the nonfarm payrolls (which is due next Friday). This Friday is looking uniquely interesting however. Not only are we heading into the end of the week, but this will also be the final day of trade for the month of September and the third quarter. Historically, September has averaged the worst performance from the S&P 500 – as a stand in for ‘risk’ – through the calendar year averaged out back to 1980. Meanwhile, volatility begins its peak between this and next month, though volume sees a significant difference considering October tends to draw the heaviest turnover of the year. This is a lot to anticipate, and market participants are in a position to be particularly aware of their environment.
Chart of Average S&P 500 Performance, Volume and Volatility by Calendar Month
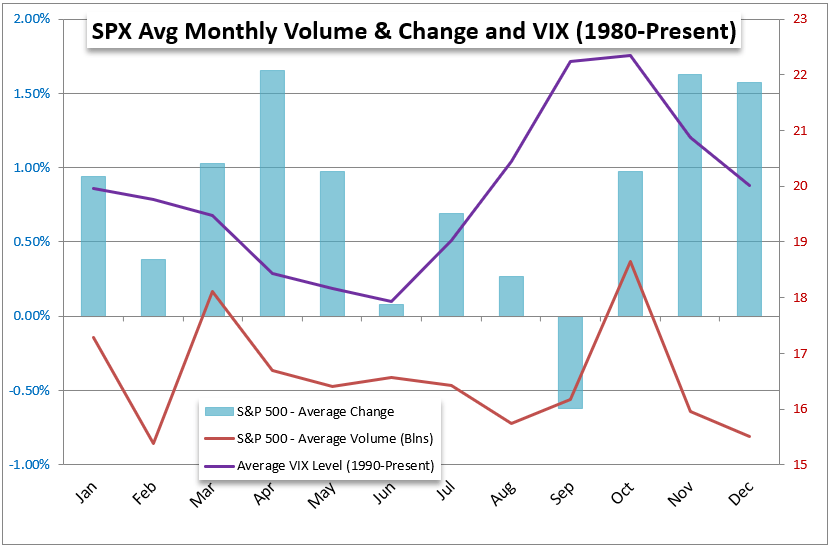
Chart Created by John Kicklighter
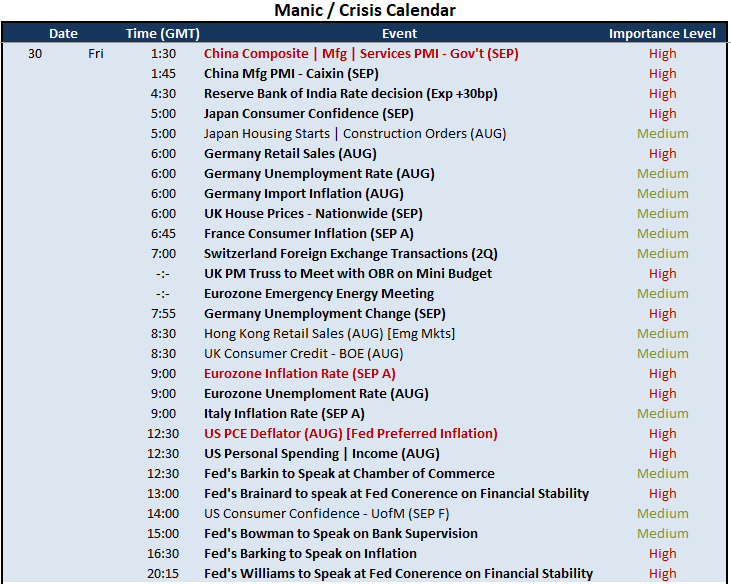
Another complication to a quiet end of the week/month/quarter is the density of important scheduled event risk through the end of this week. Not only is there a range of high profile events – such as the Indian central bank rate decision, German employment data and Fed officials speaking on financial stability – but there are key updates that will weigh in directly with systemically important themes. On the ever-present recession watch, I will be watching the Chinese government’s September PMI figures as well as any headlines that come out of UK Prime Minister Truss’s emergency meeting with the OBR on the recently proposed mini budget. More influential would be the Eurozone and United States’ top consumer inflation reports, but those too may ultimately role down into a gauge of recession risks.
Critical Macro Event Risk on Global Economic Calendar for the Next 24 Hours
Calendar Created by John Kicklighter
EURUSD and Interest Rates
Top event risk Friday from my perspective are the inflation figures from Europe and the United States. Both major economies are struggling to reign in rampant price growth before it becomes a permanent fixture. The slow response to the rapid inflation climb in hopes that the wave was transitory now finds the authorities scrambling to get back ahead of the curve with dramatic increases in interest rates. The speculation of a fourth consecutive 75 basis point rate hike from the Federal Reserve at its next meeting on November 2nd is more conservative at a 59 percent probability, but it is still the top scenario. Meanwhile, the market is pricing in a more than 90 percent chance that the ECB will hike 75 basis points towards the end of October (specifically the 27th). Rate forecasts matter for relative currency appeal, but they are also the fuel for risk throttling. The longer the projected path of rate increases moving forward, the longer the potential for volatility around this theme. The Fed rate is seen peaking around March, with the BOE and ECB projected to tighten further into the future.
Chart of VIX Volatility Index with 20 and 50-Week SMAs (Weekly)
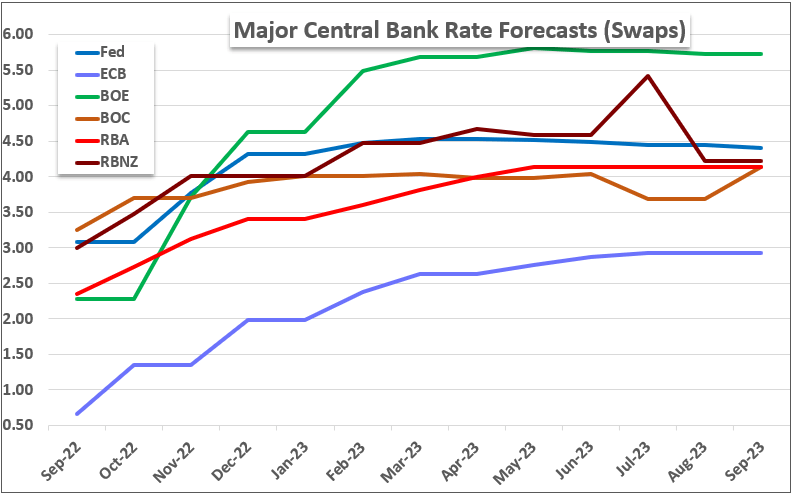
Chart Created on Tradingview Platform
While I believe it is important to monitor general risk trends moving into the final trading session of the week, it seems EURUSD is the most ‘put upon’ asset given the top event risk. When there are two high profile economic releases like the September Eurozone CPI and August US PCE deflator, it is possible for the data to align (one bullish, one bearish) or conflict (both bullish or bearish). There is no certainty of path such that volatility can be relied upon to give a clear trend. Nonetheless, I believe this data should be absorbed whether it be for the purpose of plotting scenarios for EURUSD or to more generally garner a better picture of the overall financial system moving forward.
| Change in | Longs | Shorts | OI |
| Daily | -4% | 2% | -2% |
| Weekly | -27% | 52% | -10% |
Chart of EURUSD with 50-Day SMA, 2-Day Rate of Change and 50-Day Disparity (Daily)
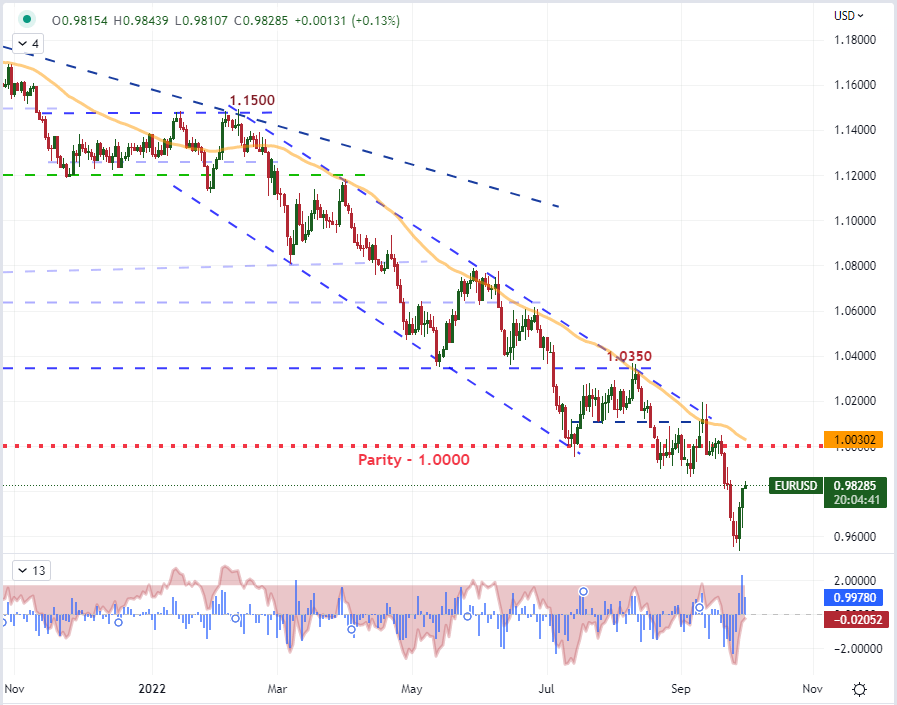
Chart Created on Tradingview Platform

Discover what kind of forex trader you are

