

Polkadot price had touched the $8 price level before the bulls lost steam and fell on the one-day chart. DOT travelled 3.6% lower in the last 24 hours on its chart.
Over the past week, DOT had gained some value, but most of that was nullified at press time.
The Polkadot price was making a recovery over the last two days as it had declined before that. Buyers had stepped in during the recovery period.
At the time of writing, however, buyers had exited the market again. The technical outlook for the coin was bearish, with sellers taking over the market.
The support zone for Polkadot price stood between $6.16 and $5.52. A fall below the $5.52 mark could bring DOT down below the $5 mark.
As Bitcoin’s bulls fizzled out in the market, most altcoins that registered gains also started to lose their bullish momentum.
If demand for DOT increases on its chart, the coin can attempt to revisit its immediate resistance mark. If buying power continues to fall, DOT will return to its local price support line.
Polkadot Price Analysis: One Day Chart
DOT was trading at $6.29 at the time of writing. The bulls tried hard to defend the price of the altcoin at $8, but buying strength fell, and it caused the altcoin to fall on its chart.
The Polkadot price will witness a tough price ceiling at the $6.80 mark as the coin has been rejected at that level a couple of times in the past.
A move past the $6.80 level will help DOT inch near the $7.73 price mark. On the flip side, the local support level for the coin stood at $6.17 and a fall from that mark would push Polkadot near the $5.52 level.
Over the last trading session, the amount of Polkadot traded fell, signalling declining buying strength.
Technical Analysis
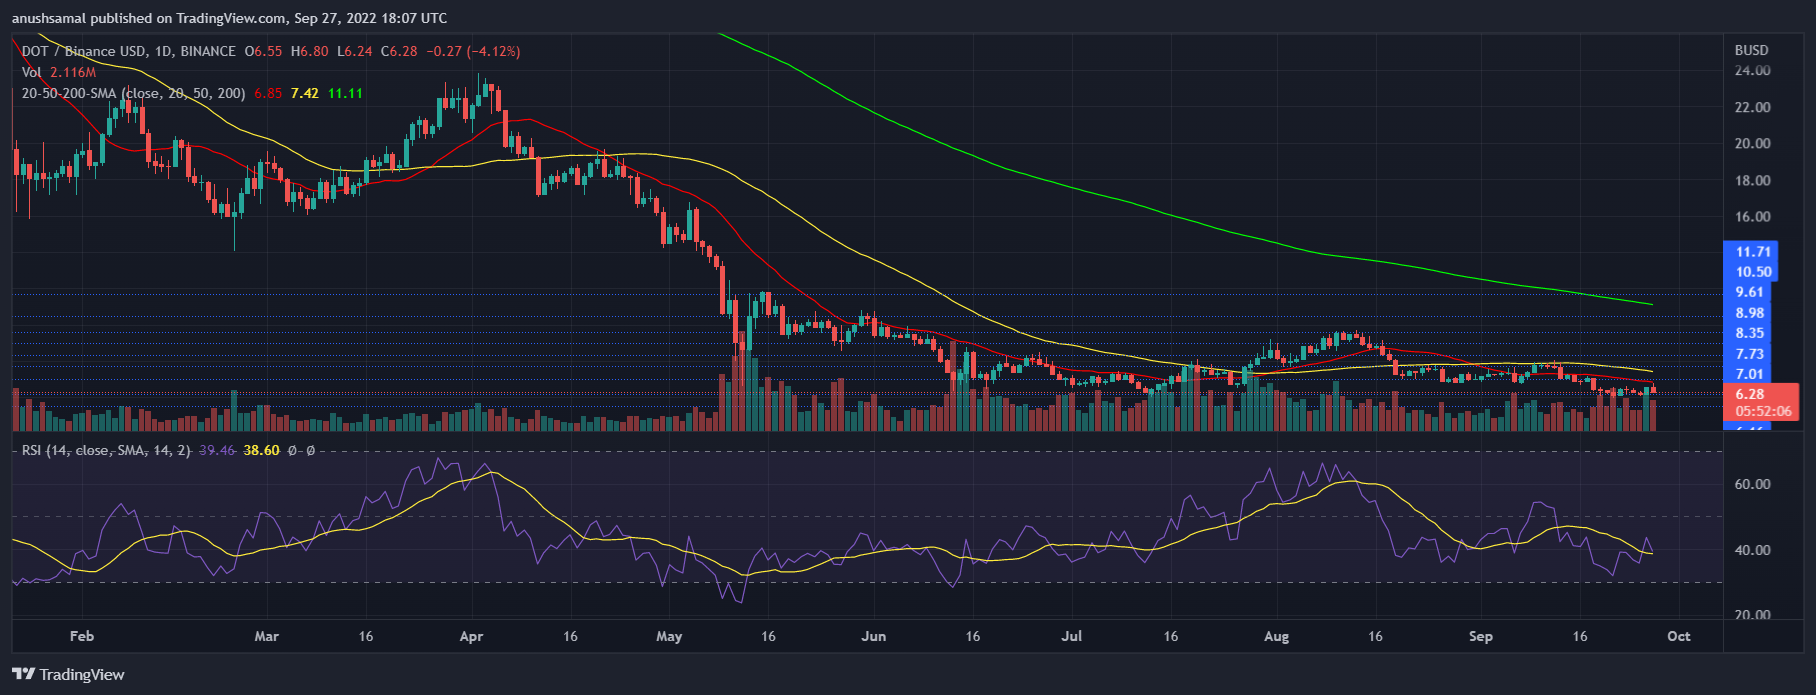
DOT was displaying that there was a fall in buying strength on the one-day chart. For most of this month, Polkadot price witnessed increased selling pressure, which has caused the bears to eventually gain more strength.
The Relative Strength Index was below the half-line, and that meant sellers were out in force compared to buyers in the market.
Polkadot was below the 20-SMA line, and that can be interpreted as less demand. It also meant that sellers were driving the price momentum on the one-day chart.
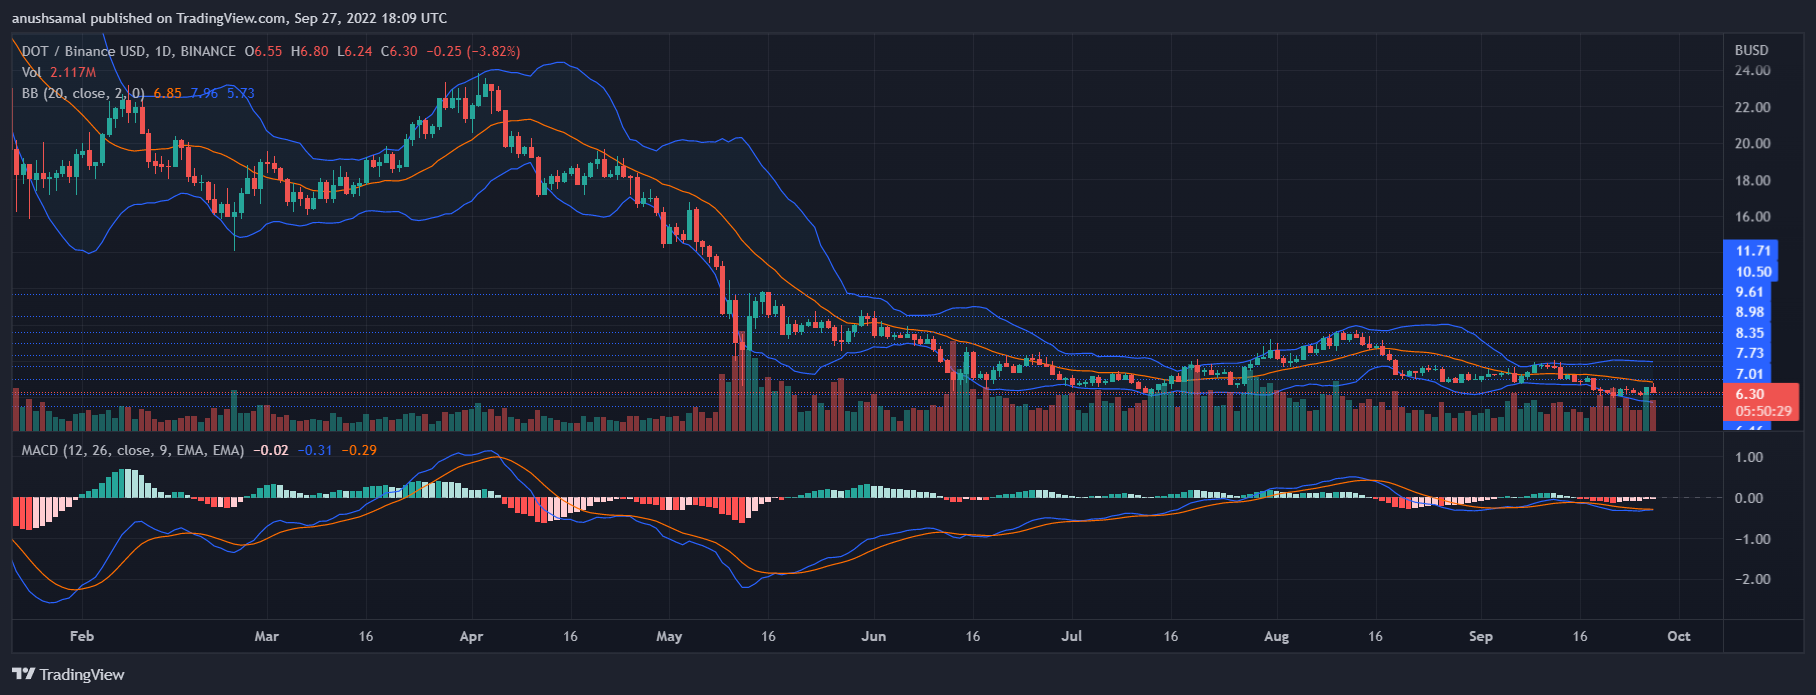
DOT’s technical indicators displayed that selling strength had taken over the chart. The Moving Average Convergence Divergence indicates the price momentum and overall price action of the coin.
The MACD continued to display red signal bars, which were also sell signal for the coin. Bollinger Bands measure price volatility and price fluctuation.
The bands had widened as they reflected incoming price fluctuations for the altcoin.

