

Updated on October 13th, 2022 by Bob Ciura
In the world of investing, volatility matters. Investors are reminded of this every time there is a downturn in the broader market and individual stocks that are more volatile than others experience enormous swings in price.
Volatility is a proxy for risk; more volatility generally means a riskier portfolio. The volatility of a security or portfolio against a benchmark is called Beta.
In short, Beta is measured via a formula that calculates the price risk of a security or portfolio against a benchmark, which is typically the broader market as measured by the S&P 500.
Here’s how to read stock betas:
- A beta of 1.0 means the stock moves equally with the S&P 500
- A beta of 2.0 means the stock moves twice as much as the S&P 500
- A beta of 0.0 means the stocks moves don’t correlate with the S&P 500
- A beta of -1.0 means the stock moves precisely opposite the S&P 500
Interestingly, low beta stocks have historically outperformed the market… But more on that later.
You can download a spreadsheet of the 100 lowest beta stocks (along with important financial metrics like price-to-earnings ratios and dividend yields) below:
This article will discuss beta more thoroughly, why low-beta stocks tend to outperform, and provide a discussion of the 5 lowest-beta dividend stocks in the Sure Analysis Research Database. The table of contents below allows for easy navigation.
Table of Contents
The Evidence for Low Beta Outperformance
Beta is helpful in understanding the overall price risk level for investors during market downturns in particular. The lower the Beta value, the less volatility the stock or portfolio should exhibit against the benchmark. This is beneficial for investors for obvious reasons, particularly those that are close to or already in retirement, as drawdowns should be relatively limited against the benchmark.
Importantly, low or high Beta simply measures the size of the moves a security makes; it does not mean necessarily that the price of the security stays nearly constant. Indeed, securities can be low Beta and still be caught in long-term downtrends, so this is simply one more tool investors can use when building a portfolio.
The conventional wisdom would suggest that lower Beta stocks should underperform the broader markets during uptrends and outperform during downtrends, offering investors lower prospective returns in exchange for lower risk.
However, history would suggest that simply isn’t the case. Indeed, this paper from Harvard Business School suggests that not only do low Beta stocks not underperform the broader market over time – including all market conditions – they actually outperform.
A long-term study wherein the stocks with the lowest 30% of Beta scores in the US were pitted against stocks with the highest 30% of Beta scores suggested that low Beta stocks outperform by several percentage points annually.
Over time, this sort of outperformance can mean the difference between a comfortable retirement and having to continue working. While low Beta stocks aren’t a panacea, the case for their outperformance over time – and with lower risk – is quite compelling.
How To Calculate Beta
The formula to calculate a security’s Beta is fairly straightforward. The result, expressed as a number, shows the security’s tendency to move with the benchmark.
For example, a Beta value of 1.0 means that the security in question should move in lockstep with the benchmark. A Beta of 2.0 means that moves in the security should be twice as large in magnitude as the benchmark and in the same direction, while a negative Beta means that movements in the security and benchmark tend to move in opposite directions or are negatively correlated.
Related: The S&P 500 Stocks With Negative Beta.
In other words, negatively correlated securities would be expected to rise when the overall market falls, or vice versa. A small value of Beta (something less than 1.0) indicates a stock that moves in the same direction as the benchmark, but with smaller relative changes.
Here’s a look at the formula:

The numerator is the covariance of the asset in question with the market, while the denominator is the variance of the market. These complicated-sounding variables aren’t actually that difficult to compute – especially in Excel.
Additionally, Beta can also be calculated as the correlation coefficient of the security in question and the market, multiplied by the security’s standard deviation divided by the market’s standard deviation.
Finally, there’s a greatly simplified way to calculate Beta by manipulating the capital asset pricing model formula (more on Beta and the capital asset pricing model later in this article).
Here’s an example of the data you’ll need to calculate Beta:
- Risk-free rate (typically Treasuries at least two years out)
- Your asset’s rate of return over some period (typically one year to five years)
- Your benchmark’s rate of return over the same period as the asset
To show how to use these variables to do the calculation of Beta, we’ll assume a risk-free rate of 2%, our stock’s rate of return of 7% and the benchmark’s rate of return of 8%.
You start by subtracting the risk-free rate of return from both the security in question and the benchmark. In this case, our asset’s rate of return net of the risk-free rate would be 5% (7% – 2%). The same calculation for the benchmark would yield 6% (8% – 2%).
These two numbers – 5% and 6%, respectively – are the numerator and denominator for the Beta formula. Five divided by six yields a value of 0.83, and that is the Beta for this hypothetical security. On average, we’d expect an asset with this Beta value to be 83% as volatile as the benchmark.
Thinking about it another way, this asset should be about 17% less volatile than the benchmark while still having its expected returns correlated in the same direction.
Beta & The Capital Asset Pricing Model (CAPM)
The Capital Asset Pricing Model, or CAPM, is a common investing formula that utilizes the Beta calculation to account for the time value of money as well as the risk-adjusted returns expected for a particular asset.
Beta is an essential component of the CAPM because without it, riskier securities would appear more favorable to prospective investors. Their risk wouldn’t be accounted for in the calculation.
The CAPM formula is as follows:


The variables are defined as:
- ERi = Expected return of investment
- Rf = Risk-free rate
- βi = Beta of the investment
- ERm = Expected return of market
The risk-free rate is the same as in the Beta formula, while the Beta that you’ve already calculated is simply placed into the CAPM formula. The expected return of the market (or benchmark) is placed into the parentheses with the market risk premium, which is also from the Beta formula. This is the expected benchmark’s return minus the risk-free rate.
To continue our example, here is how the CAPM actually works:
ER = 2% + 0.83(8% – 2%)
In this case, our security has an expected return of 6.98% against an expected benchmark return of 8%. That may be okay depending upon the investor’s goals as the security in question should experience less volatility than the market thanks to its Beta of less than 1. While the CAPM certainly isn’t perfect, it is relatively easy to calculate and gives investors a means of comparison between two investment alternatives.
Now, we’ll take a look at five stocks that not only offer investors low Beta scores, but attractive prospective returns as well.
Analysis On The 5 Lowest-Beta Dividend Stocks
The following 5 stocks have the lowest (but positive) Beta values, in ascending order from lowest to highest. They also pay dividends to shareholders. We focused on Betas above 0, as we are still looking for stocks that are positively correlated with the broader market:
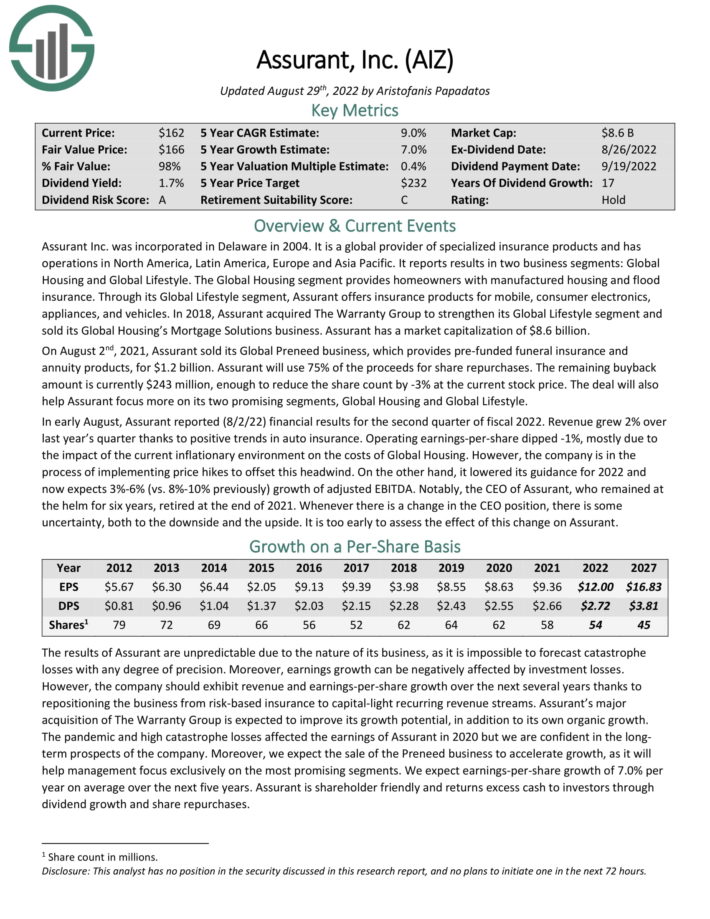
5. Assurant Inc. (AIZ)
Assurant Inc. is a global provider of specialized insurance products and has operations in North America, Latin America, Europe and Asia Pacific. It reports results in two business segments: Global Housing and Global Lifestyle. The Global Housing segment provides homeowners with manufactured housing and flood insurance.
Through its Global Lifestyle segment, Assurant offers insurance products for mobile, consumer electronics, appliances, and vehicles. In 2018, Assurant acquired The Warranty Group to strengthen its Global Lifestyle segment and sold its Global Housing’s Mortgage Solutions business.
On August 2nd, 2021, Assurant sold its Global Preneed business, which provides pre-funded funeral insurance and annuity products, for $1.2 billion. Assurant will use 75% of the proceeds for share repurchases. The remaining buyback amount is currently $243 million, enough to reduce the share count by -3% at the current stock price. The deal will also help Assurant focus more on its two promising segments, Global Housing and Global Lifestyle.
In early August, Assurant reported (8/2/22) financial results for the second quarter of fiscal 2022. Revenue grew 2% over last year’s quarter thanks to positive trends in auto insurance. Operating earnings-per-share dipped -1%, mostly due to the impact of the current inflationary environment on the costs of Global Housing.
However, the company is in the process of implementing price hikes to offset this headwind. On the other hand, it lowered its guidance for 2022 and now expects 3%-6% (vs. 8%-10% previously) growth of adjusted EBITDA.
AIZ has a Beta score of 0.53.
Click here to download our most recent Sure Analysis report on Assurant (preview of page 1 of 3 shown below):

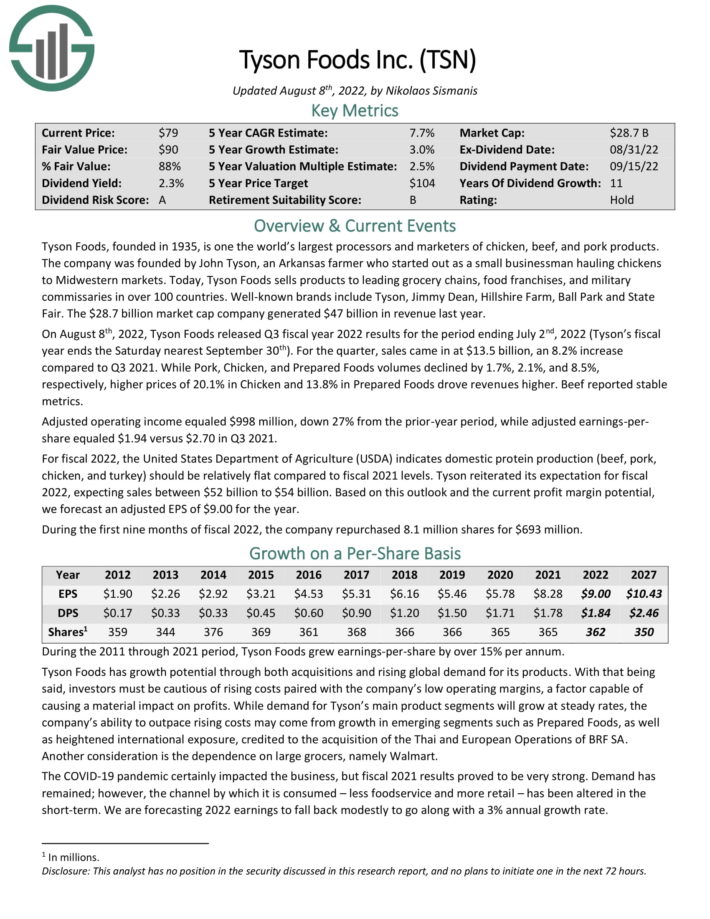
4. Tyson Foods (TSN)
Tyson Foods, founded in 1935, is one the world’s largest processors and marketers of chicken, beef and pork products. The company was founded by John Tyson, an Arkansas farmer who started out as a small businessman hauling chickens to Midwestern markets.
Today, Tyson Foods sells products to leading grocery chains, food franchises, and military commissaries in over 100 countries. Well–known brands include Tyson, Jimmy Dean, Hillshire Farm, Ball Park and State Fair. The company generated $47 billion in revenue last year.
The company generated top-line growth in the third fiscal quarter:


Source: Investor Presentation
On August 8th, 2022, Tyson Foods released Q3 fiscal year 2022 results for the period ending July 2nd, 2022 (Tyson’s fiscal year ends the Saturday nearest September 30th). For the quarter, sales came in at $13.5 billion, an 8.2% increase compared to Q3 2021.
While Pork, Chicken, and Prepared Foods volumes declined by 1.7%, 2.1%, and 8.5%, respectively, higher prices of 20.1% in Chicken and 13.8% in Prepared Foods drove revenues higher. Beef reported stable metrics. Adjusted operating income equaled $998 million, down 27% from the prior-year period, while adjusted earnings-pershare equaled $1.94 versus $2.70 in Q3.
TSN has a 5-year Beta of 0.50.
Click here to download our most recent Sure Analysis report on TSN (preview of page 1 of 3 shown below):
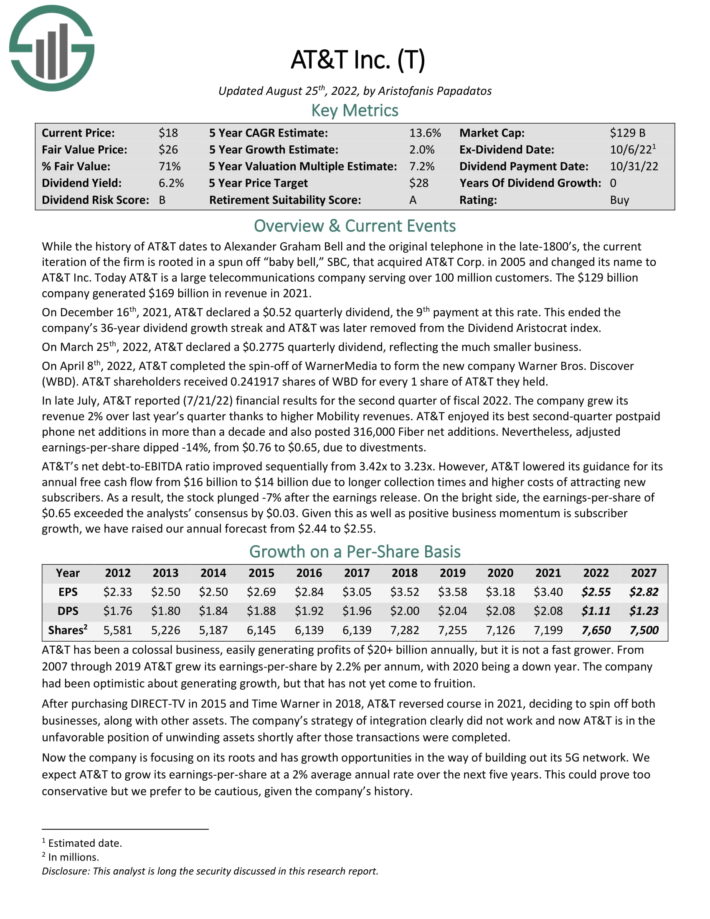
3. AT&T Inc. (T)
AT&T is a large telecommunications company serving over 100 million customers. The company generated $169 billion in revenue in 2021.
In April 2022, AT&T completed the spin-off of WarnerMedia to form the new company Warner Bros. Discovery (WBD). AT&T shareholders received 0.241917 shares of WBD for every 1 share of AT&T they held.
Related: Communication Services Stocks List | The 5 Best Now
![]()
![]()

Source: Investor Presentation
In late July, AT&T reported (7/21/22) financial results for the second quarter of fiscal 2022. The company grew its revenue 2% over last year’s quarter thanks to higher Mobility revenues. AT&T enjoyed its best second-quarter postpaid phone net additions in more than a decade and also posted 316,000 Fiber net additions. Nevertheless, adjusted earnings-per-share dipped -14%, from $0.76 to $0.65, due to divestments.
AT&T has a Beta score of 0.47.
Click here to download our most recent Sure Analysis report on AT&T (preview of page 1 of 3 shown below):
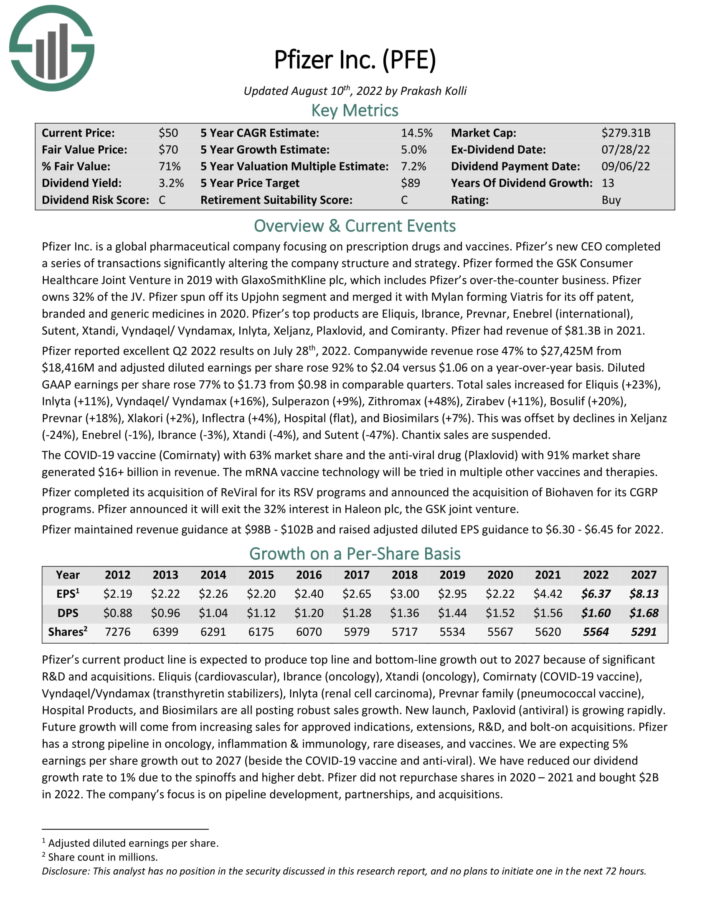
2. Pfizer Inc. (PFE)
Pfizer Inc. is a global pharmaceutical company that focuses on prescription drugs and vaccines. With a market capitalization above $200 billion, Pfizer is a mega-cap stock.
Pfizer’s new CEO completed a series of transactions significantly altering the company structure and strategy. Pfizer formed the GSK Consumer Healthcare Joint Venture in 2019 with GlaxoSmithKline plc (GSK), which includes Pfizer’s over-the-counter business. Pfizer owns 32% of the JV. Pfizer spun off its Upjohn segment and merged it with Mylan forming Viatris for its off patent, branded and generic medicines in 2020.
Pfizer’s top products are Eliquis, Ibrance, Prevnar, Enebrel (international), Sutent, Xtandi, Vyndaqel/ Vyndamax, Inlyta, Xeljanz, Plaxlovid, and Comiranty. Pfizer had revenue of $81.3B in 2021.
Pfizer reported excellent Q2 2022 results on July 28th, 2022.
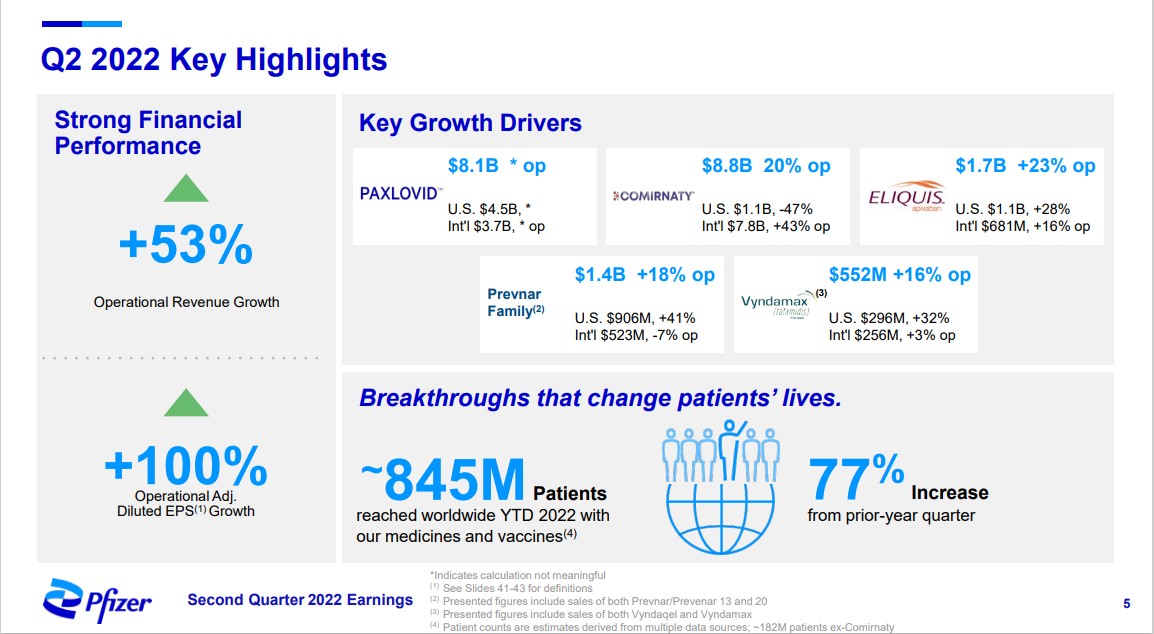

Source: Investor Presentation
Company-wide revenue rose 47% and adjusted diluted earnings per share rose 92% on a year-over-year basis. Pfizer maintained revenue guidance at $98B – $102B and raised adjusted diluted EPS guidance to $6.30 – $6.45 for 2022.
PFE has a Beta score of 0.37.
Click here to download our most recent Sure Analysis report on Pfizer (preview of page 1 of 3 shown below):
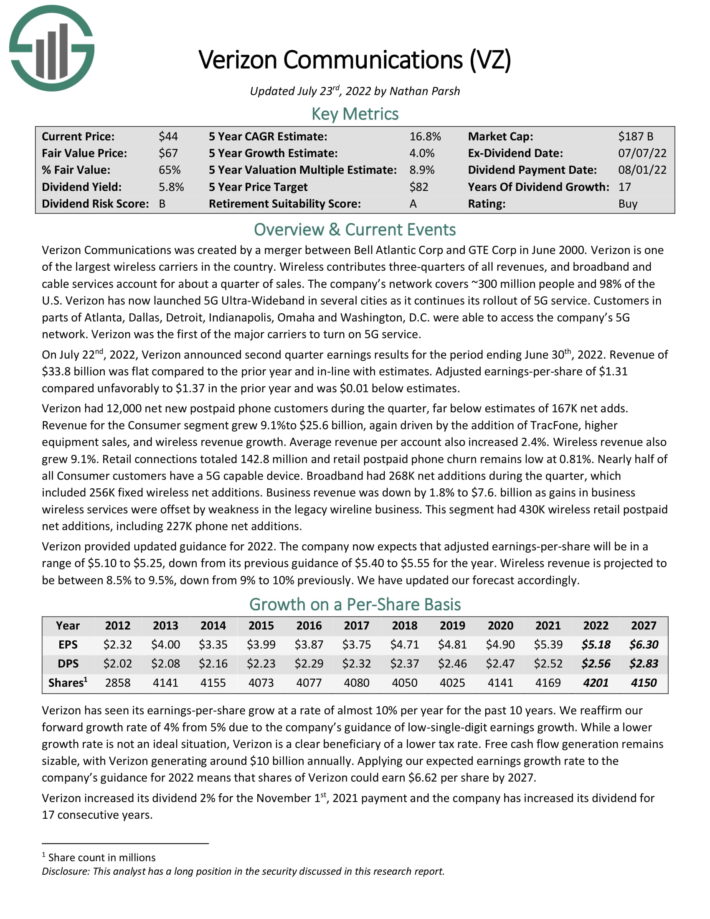
1. Verizon Communications (VZ)
Verizon Communications is one of the largest wireless carriers in the country. Wireless contributes three-quarters of all revenues, and broadband and cable services account for about a quarter of sales. The company’s network covers ~300 million people and 98% of the U.S.
On July 22, 2022, the company reported the fiscal year’s second-quarter and first six months results. Revenue was flat year over year (YoY) at $33.8 billion for the quarter compared to the second quarter in 2021. Earnings came in at $1.24 per share, a decrease of 11.4% compared to the $1.40 per share the company made in 2Q201.

Source: Investor Presentation
The company had a net addition of 268,000, including 256,000 fixed wireless net additions. Total broadband net additions increased by 39,000 from first-quarter 2022, and fixed wireless net additions increased by 62,000 from first-quarter 2022.
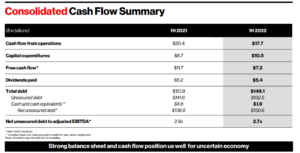
The cash flow from operations was down for the year’s first half from $20.4 billion to $17.7 billion. While capital expenditures were up $2.4 billion to $10.5 billion in the first half. Free cash flow for the quarter was down from $11.7 billion to $7.2 billion for the first half of the year.
VZ has a Beta score of 0.34.
Click here to download our most recent Sure Analysis report on VZ (preview of page 1 of 3 shown below):
Final Thoughts
Investors must take risk into account when selecting from prospective investments. After all, if two securities are otherwise similar in terms of expected returns but one offers a much lower Beta, the investor would do well to select the low Beta security as they may offer better risk-adjusted returns.
Using Beta can help investors determine which securities will produce more volatility than the broader market and which ones may help diversify a portfolio, such as the ones listed here.
The five stocks we’ve looked at not only offer low Beta scores, but they also offer attractive dividend yields. Sifting through the immense number of stocks available for purchase to investors using criteria like these can help investors find the best stocks to suit their needs.
At Sure Dividend, we often advocate for investing in companies with a high probability of increasing their dividends each and every year.
If that strategy appeals to you, it may be useful to browse through the following databases of dividend growth stocks:
Thanks for reading this article. Please send any feedback, corrections, or questions to support@suredividend.com.